Stocks tend to move in 3 patterns.
The way I visualize this is in breakdowns, continuation patterns (bull flag / pennant), and breakouts.
Breakdowns and breakouts are my favorites because they present the most volatility and range in both directions.
To better understand Japanese candlestick patterns I recommend The Candlestick Course.
Fishhook (a.k.a. Breakdown) chart pattern:
The fishhook pattern emerges on a sharp downward move in the stock price through support on heavy volume and tends to be quick in duration and severe in magnitude. Excellent for swing trades.
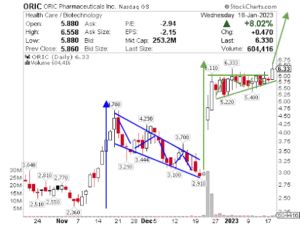
Pennant (a.k.a. Continuation) chart pattern:
A pennant will have a period of consolidation inside the triangular flag shape on lower volume followed by a breakout, outside the triangular pattern, on higher volume. This is also excellent for swing trades.
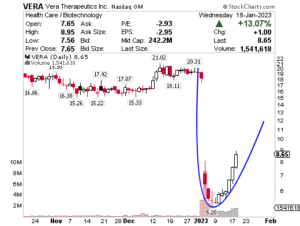
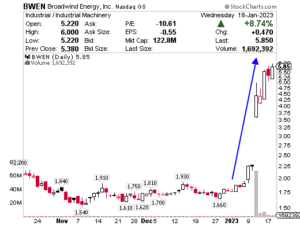
Rocket (a.k.a. Breakout) chart pattern:
A rocket is when the stock price moves outside a defined support and resistance level with increased volume. Enter long on a break above resistance or short on a break below support. In penny stocks, breakouts are often accompanied by dilution which for the most part, destroys the momentum. I use Dilution Tracker to gauge offering risk. Excellent for day trades.
PRO TIP: Here’s the checklist I use to find these monsters:
- Amazing news (filter out puffery)
- Big range (50-100% to major resistance)
- Float (smaller = could run faster through range)
- Short interest (higher = turbocharged breakout)
- Dilution risk (must be medium to low)
- Entry (am I chasing?)
- Take the trade
Some examples of breakouts I alerted you so you can see how they progress.
- VS opening range breakout [01:18]
- AMAM opening range breakout [02:05]
- LUCY opening range breakout [09:37]
- PHVS opening range breakout [02:02]
- CRKN opening range breakout [03:01]
Here’s a cheat sheet for the opening range breakouts.
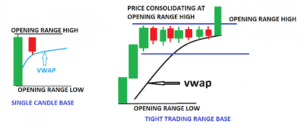
Opening Range Breakout:
An opening range breakout in stock trading refers to a strategy where a trader seeks to profit from a stock’s price movement within the first hour of the trading day.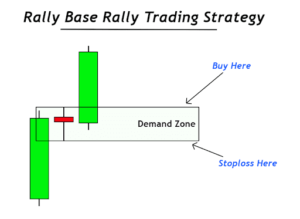
The opening range is defined as the high and low prices of a stock during the first hour of the trading day. The idea behind this strategy is that the opening range often establishes the direction and momentum for the rest of the day, and that a stock’s price will tend to continue to move in the direction of the breakout from the opening range.
To implement this strategy, a trader will identify the opening range and set a trade based on whether the stock price breaks above the high or below the low of the opening range. If the stock price breaks above the high of the opening range, the trader will enter a long position, while if it breaks below the low, the trader will enter a short position.
It’s important to note that while opening range breakouts can be a useful tool for traders, they are not without risks. Factors such as false breakouts and corrections back to the breakout point make explosions rare.
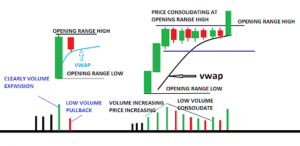
Ranges are easy to spot, making the range breakout strategy very popular. However, many traders lose money on this strategy, mainly because of false breakouts, corrections to the breakout point and unrealistic expectations. Strategies that are likely to provide traders with more success involve being patient and waiting for the breakout to happen and then trading the trend if it occurs, or waiting for a correction and seeing if the price resumes the breakout direction.
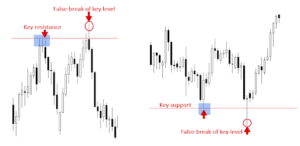
False Breakout:
A false breakout in stock trading refers to a situation where a stock price appears to have broken through a key level of resistance or support, but then quickly reverses and moves back within the previous trading range. This can occur when there is a lack of buying or selling pressure to sustain the price movement beyond the key level.
False breakouts can be misleading and can cause traders to enter into a position too early or in the wrong direction. For example, a trader may enter into a long position when the stock price appears to have broken above a key resistance level, only to see the price quickly fall back down and close within the previous trading range.
To avoid false breakouts, traders often look for additional confirmations, such as increased volume or a move above a moving average, before entering a position. It is also important to consider other factors such as market conditions and news events that may be affecting the stock price.
Shooting Star:
A shooting star in stock trading refers to a candlestick pattern that is formed when the price of a security increases significantly during a short period of time and then falls back to near its original level, creating a tall candle with a small upper shadow and a long lower shadow.
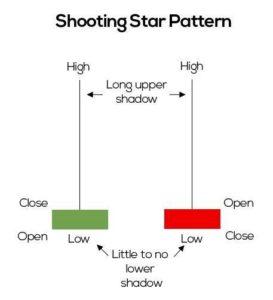
This pattern is often seen as a bearish reversal signal, indicating that the uptrend may be coming to an end and that the price may continue to decrease in the near future.
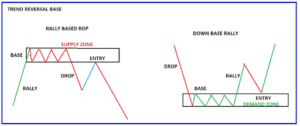
Base Trade:
A base trade in stock trading refers to a strategy where an investor buys a stock that has gone through a period of consolidation or correction and is showing signs of building a base or forming a new support level. The idea behind this strategy is to buy the stock at its current price, with the expectation that it will eventually break out of the base and move higher.
In order to identify a base, traders often look for patterns such as flag and pennant formations, cup and handle formations, or double and triple bottoms. Once a base has been identified, traders will typically wait for the stock to break above the top of the base and show signs of strength, such as increased volume or a move above its moving average, before entering a long position.
THRUST Analysis:
Thrust refers to the distance between the current swing high to a previous swing high (in an uptrend) or swings low (in a downtrend). Increased thrust is a sign of potential trend strength. Shortening of Thrust is a sign of potential trend weakness.
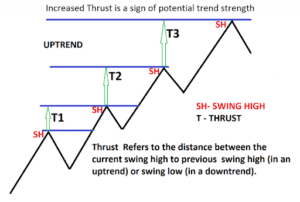
The increased thrust of T2, when compared with T1, indicates greater strength within the trend. Also compared with T3 to T2 indicating strength on the upside.
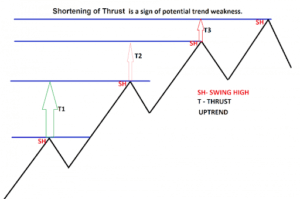
Shortening of thrust, T2 when compared with T1 indicates weakness with the trend. T3 is then much shorter than T2, indicating weakness developing with the trend. T2 is unable to project to the same distance as T1 did. Something has shifted in the balance of supply and demand. The fact that the market was unable to do so indicates either a decrease in bullish pressure and/or an increase in bearish pressure.
The uptrend is showing signs of weakening
So there you have it! I hope you enjoyed my Cheat Sheet – and if you want more of this kind of education, I invite you to…
Learn more about Lightning Alerts here.

Related Articles: