

When technical analysts measure the participation within a market trend, they’re measuring the “breadth” of the market.
In other words, they’re analysing how many of an index’s constituents are making new highs when the index is making new highs, or how many constituents are making new lows when the index is in a downtrend.
Throughout history, there are countless examples of how breadth divergences against the underlying index have acted as a leading indicator of major market pullbacks.
The problem with these divergences, however, is that they can often develop over very long time periods before the market finally turns.
In other words, rather than using these divergences as precision timing tools they should be viewed as a reason not to carry too much leverage or overexposure that could cause your account to be wiped out when the market finally reacts negatively.
Today, we’re going to examine the granddaddy of all breadth indicators, and combine its current signal with another key indicator to determine the potential that a meaningful top in the market is finally near.
The NYSE Advance-Decline is the most widely followed Breadth indicator
According to Stockcharts.com, “The Advance-Decline Line (AD Line) is a breadth indicator based on Net Advances, which is the number of advancing stocks less the number of declining stocks. Net Advances is positive when advances exceed declines and negative when declines exceed advances. The AD Line is a cumulative measure of Net Advances, rising when it is positive and falling when it is negative. Chartists can use Net Advances to plot the AD Line for the index and compare it to the performance of the actual index.
When an uptrend is strong, the Advance-Decline Line should confirm the advance by making new highs with the index.
Conversely, when a downtrend is strong, the AD Line should confirm the decline by making new lows with the index.
When non-confirmation, or divergence, occurs it usually foreshadows a trend reversal.
As I noted in my opening comments, however, timing these reversals is usually difficult.
Keeping an eye on this breadth indicator is important because it can warn us when financial market liquidity is becoming a problem.
For much of the 2021 rally, one of the biggest issues that many bears have leaned on is the fact that the major indices have been carried higher by a handful of really big capitalization stocks, as the smaller companies have been fighting for liquidity in the same market.
When fewer buyers are entering the market it causes liquidity to dry up, and it’s usually the smaller companies that suffer first.
In the past, I’ve used the “canary in a coalmine” analogy to describe how certain market indicators provide an early warning that the underlying health of the market is not what it appears to be on the surface.
When it comes to the past divergence examples shown on Figure 1 below, this is yet another example of this.
To compare apples to apples, I’ve placed the New York Stock Exchange (NYSE) Advance-Decline line (top panel) on Figure 1 below along with the price of the NYSE (bottom panel).
Figure 1
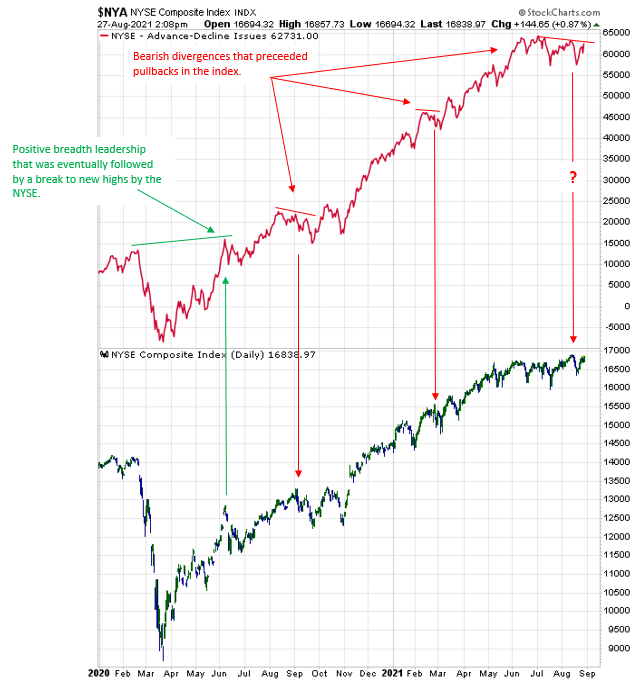
In the relatively short period of time that has passed since the COVID crisis lows, you can see how this indicator has acted as a coincident indicator, confirming the NYSE when it was in midst of strong rallies, and as a leading indicator, not only diverging lower against the index prior to the small downside corrections, but also diverging higher against the index prior to its late 2020 break higher.
How should traders play the current breadth divergence?
If it seems like we’ve had this discussion many times in recent months, that’s because we have.
Bull markets usually produce numerous instances when prices make new highs at the same time many of our favorite indicators are not confirming the move, causing us to question the sustainability of the rally.
At some point, the major indices will no longer go straight up and will start to witness the kinds of volatility cycles that have occurred for hundreds of years.
Until that time comes, it’s certainly a good thing to be skeptical when things like major breadth diverges occur.
At the same time, though, we must trade the trend, which means fighting the urge to take big positions against the trend until the ultimate arbiter, price, tells us otherwise.
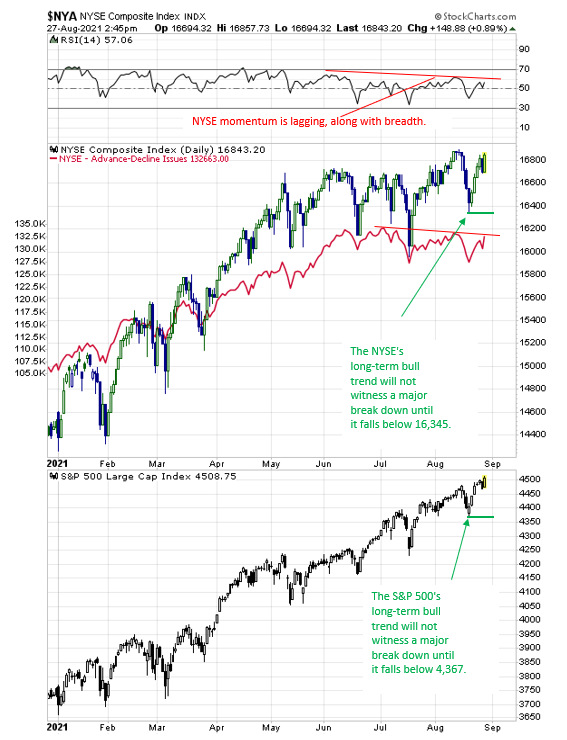
So, while the NYSE Advance-Decline line’s lack of confirmation for the NYSE’s new August price highs now combines with a lack of upside momentum confirmation as shown on Figure 2 below, the broader market will not signal that the current uptrend is witnessing a major breakdown until the S&P 500 falls below 4367 and the NYSE falls below 16,345.
Figure 2


2 Comments
THATS A FIRST, FOR THIS KIND OF INFO. THANKYOU& GOD BLESS YOU!7
A good alert on the state of the market.