
Since the COVID crisis lows of early 2020, the steady stream of higher highs and higher lows the major US equity indices have developed has left a trail of carnage in the form of stock market bears.
It is said that bull “markets climb a wall of worry,” and this bull market has certainly had its fair share of concerns.
As things grow closer to what is historically the worst month of the year for stocks, September, the recent spike in COVID cases, concerns about how the Fed will respond to rising inflation pressures, and the chaos in Afghanistan are the latest additions to this list.
As traders, our success lies in our ability to listen to what markets are telling us.
In other words, price action is the ultimate arbiter, and we must learn to identify the signals that demand attention.
I’m about to show you three important signals that the market was sending before this week’s early sell-off, and discuss whether they are still a concern.
History doesn’t repeat itself, but it often rhymes
Do enough trading and chart analysis and you’ll come to realize that stocks often respond to big, round numbers.
Specifically, stock prices often react to big price levels like $50 and $100 dollars.
For today’s purposes, however, we’re referring to the S&P 500’s strong tendency over the past two decades to witness meaningful corrections after bull market rallies of roughly 100%.
This is shown on Figure 1 below.
Figure 1
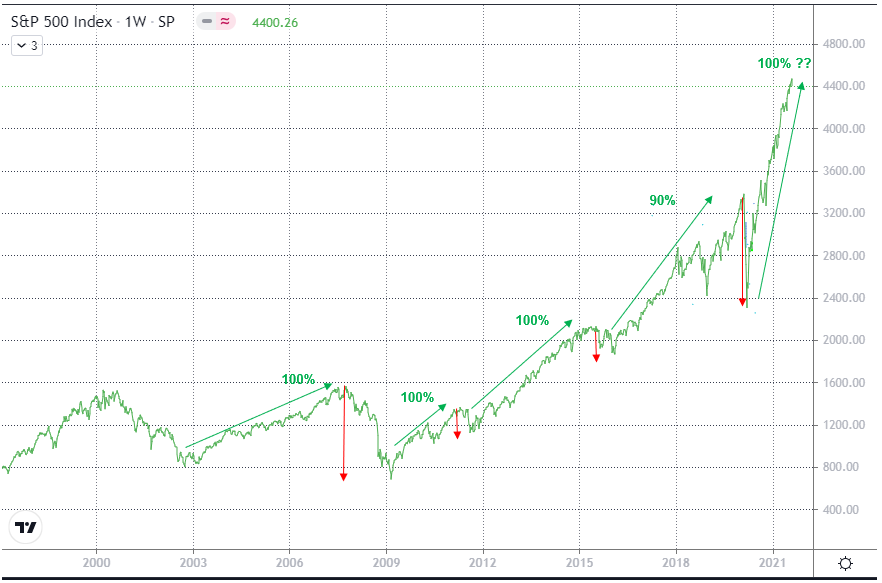
Now combine this with the age-old Wall Street adage that says, “History doesn’t repeat itself, but it often rhymes,” and you’ve got a warning sign that’s worth paying VERY close attention to.
A Dow Theory non-confirmation exists
For the past few months, stock market bears have been growing increasingly vocal about the lack of participation from Transportation stocks.
In fact, more than three months have gone by without the Transportation Average making new highs along with the benchmark S&P 500.
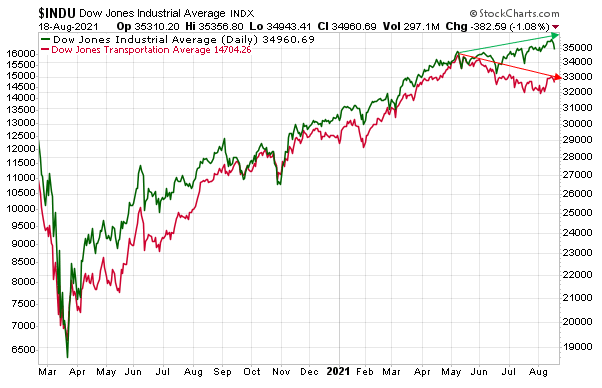
More importantly, though, new highs in the Dow Jones Industrial Average have not been confirmed by the Dow Jones Transportation Average.
Those that follow Dow Theory, one of the original investing theories, believe that bull markets are healthy when the companies that move the goods (those constituents of the Dow Jones Transportation Average) are confirming the strength in the companies that make the goods (the constituents of the Dow Jones Industrial Average).
When one index is not confirming the other, it is considered to be a Dow Theory Sell Signal.
As Figure 2 below shows, non-confirmation now exists between these two indexes.
Figure 2
Divergences between price and momentum, or between price and volume, or, in this case, between two price series, are commonly used by traders to identify possible turning points in a trend.
Just because divergences exist, however, is not enough evidence to start establishing positions against the current price trend.
For this, it is advised that the trader wait for some sign that the trend has become exhausted to the point where some degree of a correction needs to take place.
This is where Japanese candlestick reversal patterns become very helpful.
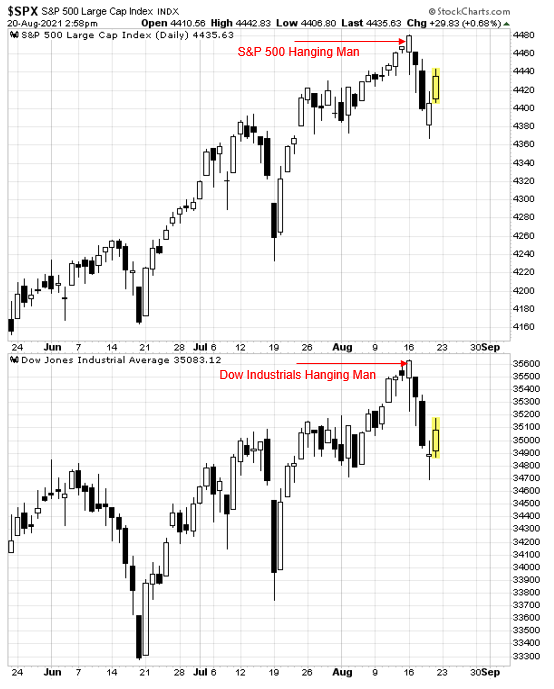
And this past week, a bearish reversal pattern known as the “hanging man” gave a bearish signal that was as clear as day right out of the gates on Monday.
What are “Hanging Man” candle patterns?
The “hanging man” candle formation, so named because it looks like a person who has been executed with legs swinging beneath, always occurs after an extended uptrend.
The hangman occurs because traders, seeing an intra-day sell-off in the shares, rush in to grab the stock at a bargain price, sparking a late-session rally that is then used by larger players to dump their remaining share on the market.
In order for the Hanging Man signal to be valid, the following conditions must exist:
- The stock must have been in a definite uptrend before this signal occurs.
- The lower shadow must be at least twice the size of the body.
- The day after the Hanging Man is formed should be a day of price weakness.
- There should be no upper shadow or a very small upper shadow.
As Figure 3 shows, both the S&P 500 and Dow Jones Industrials Average displayed clear “Hanging Man” candles this past Monday.
Figure 3
Where do we go from here?
It is widely known that the S&P 500 is currently in the midst of a rally that is historically extended without a correction of 5%.
Specifically, the benchmark is still in the midsts of the 15th longest stretch without a 5% correction since 1928.
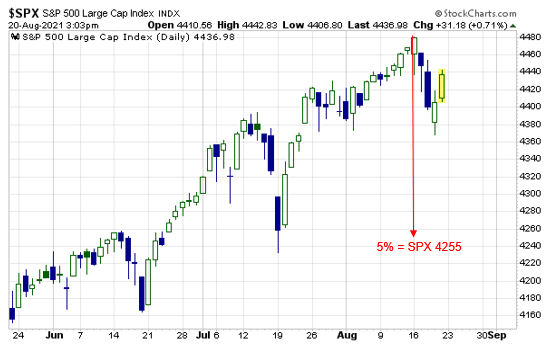
As Figure 4 below shows, for the S&P 500 to register a 5% correction from Monday’s all-time closing high, it needs to close at or below 4255.
Figure 4
While there was clearly a disruption in the short-term uptrend from early August this past week, Figure 5 shows that the benchmark index did manage to find support at an old friend this past week, the rising 50-day moving average, which joined forces with the congested 4367/4350 area.
Figure 5
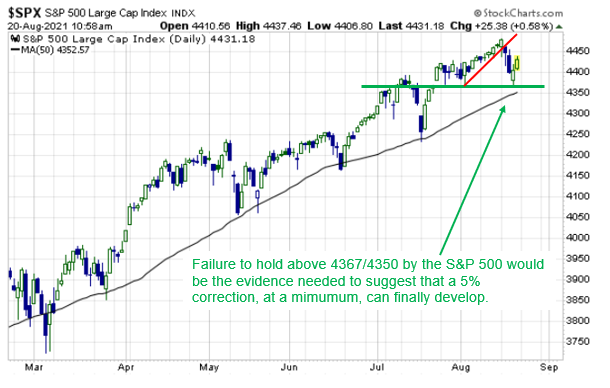
Ultimately, if a 5% correction is finally going to materialize, it’s this fortified 4375 support area that would have to give way.


1 Comments
it makes lot sense.