👋High Alert Members do the talking
Real Experts. Real Trades. Real Profits

The SPY is coming off a week where it gained nearly 2% as markets look to rally off a 3-week losing streak.
With a week of heavy economic data coming up, I’d like to share with you my single favorite indicator I use when day trading the SPY during volatile market conditions.
Besides using this ONE indicator to help me with my entry and exits on the SPY, I also love how I can see market data coming up and then prepare my trades around that. It’s one of the unique aspects of trading the SPY or S&P500 that stock traders don’t necessarily have. Being able to see the pitch coming a day or two in advance can really help give me an edge on my trading.
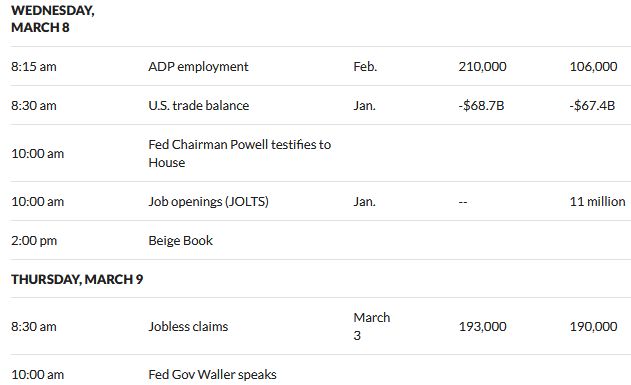
For example, I see that Wednesday and Thursday have some really high impactful pieces of market data. ADP employment (or the change in private employment) is coming up before markets open Wednesday. Fed Powell speaks that same day at 10AM, followed by Job openings and then Jobless claims on Thursday.
How can we not forget about Fed Waller on Thursday??? His last live event ended “prematurely” when he supposedly got hacked and started to stream porn (or something along those lines!)…
Either way, seeing these softballs being lobbed ahead of time allows me time to prepare for the next day or two. This might keep me from taking overnight swing trades in hopes of protecting my capital where some traders might hold blind and wake up to a total market mess.
That being said, I LOVE volatility. I mean isn’t that what most traders want? I think it’s safe to say most of us don’t trade speculative stocks with the goal of holding them for 1 year and seeking a return of 2% – boring to me, at least!
So, once I spot a trade setup I like, what’s my #1 indicator to help guide me in my entries and exits?
Bollinger Bands.
Take a look at this chart from last Friday the 3rd of March. You see the thick solid blue lines on top and bottom of price action (look like clouds) and the dotted middle line running up the middle? Those are the bollinger bands. They essentially represent volatility.
Here is how I use them. When the price action is above the dotted middle blue line (which is simply the 20 SMA) I like to buy calls on SPY. If price action is below the dotted middle blue line then I like to buy puts.
Assuming the price action stays above the middle dotted blue line, I might look to stay long my calls, maybe “trim and trail” meaning sell some to protect capital and reduce risk or maybe sell all and move on. Once the candle drops below the dotted blue line then I might consider selling and moving to a new trade.
Friday was a great example of price action staying ABOVE the dotted middle blue bollinger line almost the entire day, right up until about 3:30PM where I circled in red the price action finally falling below the middle bollinger band.
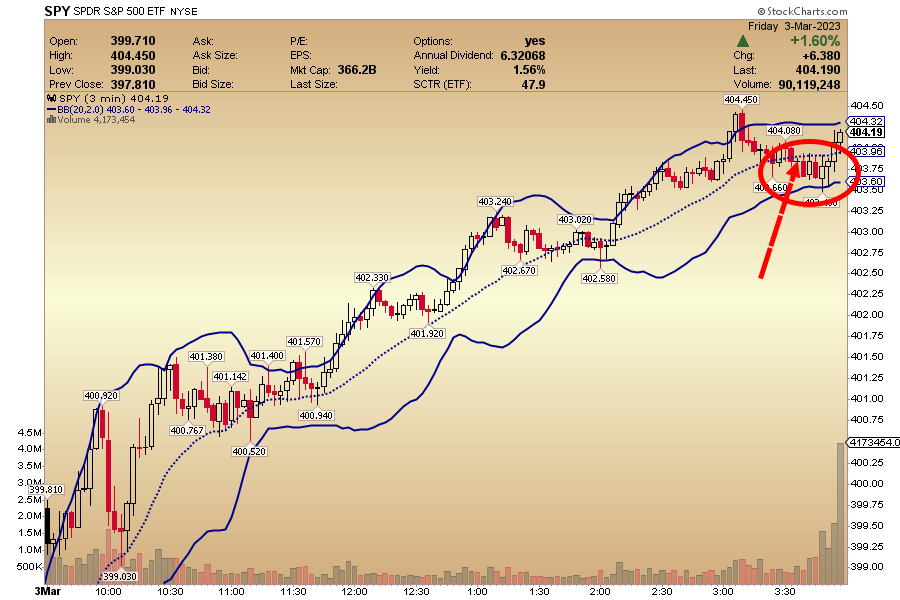
Think about that for a moment. Had I only used the middle bollinger band, I really didn’t get a sell signal until right before the close. I had a shot at a near $5 move on SPY, amazing!
I use these bollinger bands mostly on 1 and 3 minute charts during the day. I often will look for price action to be BELOW the middle bollinger band then look to buy if we cross above that line (my signal line) and then target 10 to 20% or trim and trail if the trade appears to be working for a while like Friday’s chart showed.
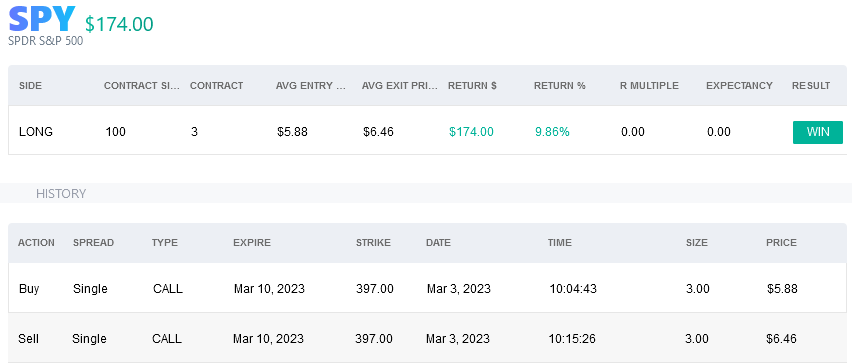
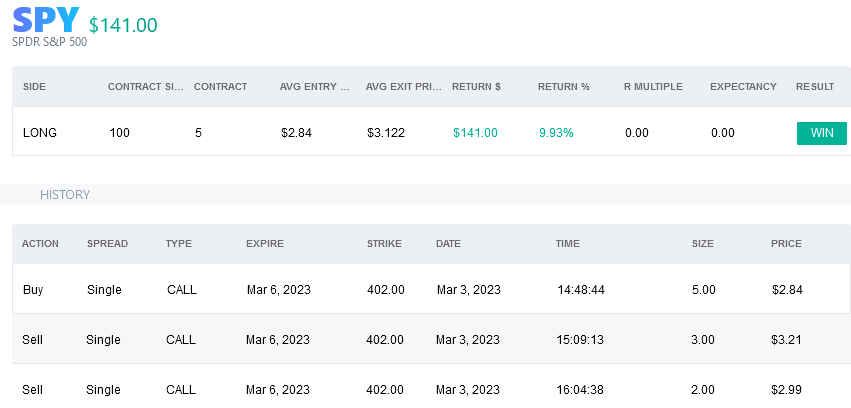
Matter of fact, I used the bollinger bands to make 2 trades on the SPY Friday. One in the morning on the dip and one in the afternoon before the fall late in the day. You can line up the times of the images below with the chat above and you’ll see how I bought the dips and sold the rips higher.
While I never recommend using just ONE indicator nor will I say the bollinger bands help me win every trade, I do feel they are a great simple to use indicator that can surely help guide me in making more educated, real time entries and exits and that’s all I can hope for.
If you would like to learn more about my trading techniques or actually watch me trade live during the day, I am offering a $1,000 savings right now to my flagship service Market Navigator.
I’ve taught thousands of traders just like you over the last 12 years (click HERE for reviews) and I am confident that I can teach you a lot about markets and how they work (click here for my trading record).
So…I’m hopeful you’ve learned something today…
And if you’d like to learn MORE, simply click here to see how you can pocket $1,000 now yet still get a full learning experience with me.

How’s your side hustle going?
It should be going GREAT since I showed you the buying opportunity that SPY was giving you as it dipped down to its rising 20-day moving average the other day.
The question now, however, is where does the market go from here?
Ever since retail traders showed evidence that they were panic selling late last year, it’s pretty much been a straight line higher for SPY in 2023.
Unfortunately, we are starting to see signs that the market may be getting a little too bullish.
After 20+ years of teaching folks like you how to trade these crazy markets, trust me when I tell you that THIS is when you need to learn how to sift through the noise of all the talking heads to see if the trend has what it takes to continue.
Here’s what I mean.
Sentiment is a powerful trading tool.
Wall Street’s biggest traders and institutional players love to wait patiently for periods of extreme fear and greed to enter the market so that they can take the other side of the trade against uninformed retail traders (don’t be one of them!).
Sometimes, however, periods of fear and greed can persist, so I make it a point to teach my Market Navigator members how to decipher between major market reversals and simple pauses.
With this next chart, I am about to let you in on a CRITICAL part of the analytical process that I go through with my Market Navigator members when sentiment is near extremes.
What this chart shows in the middle panel is a 10-day moving average of the Equity Only Put/Call ratio. Specifically, it is showing the level of Put buying divided by the level of Call buying.
When the ratio is at high extremes, it signals extreme fear as the amount of Put buying FAR EXCEEDS the amount of Call buying, which you can see was the case late last year (see SPY chart in top panel).
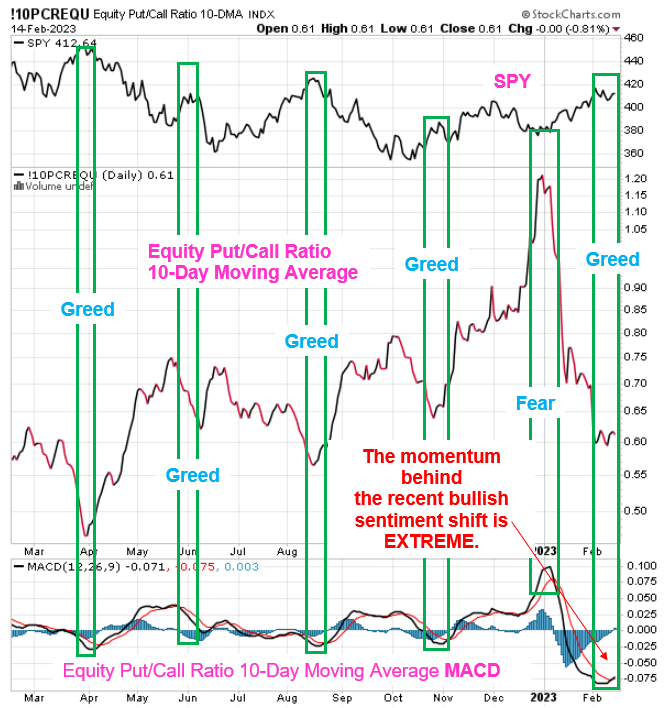
At the other end of the spectrum, when the level of Call buying far exceeds the level of Put buying, it is a sign that greed is becoming extreme.
Recently, the MACD study at the bottom of the chart shows us that the momentum behind the recent Call buying has become so extended that traders now need to be on the lookout for a possible pause in the rally.
Like I said earlier, this is not necessarily a great timing tool for telling traders when to get in and out of the market.
But it is great at telling us when we need to be careful about simply piling into the existing trend, which is STILL higher for SPY.
Now, I don’t want to put too much on your plate today by showing you another KEY ratio that I am using RIGHT NOW to gauge the strength of SPY’s trend.
But I will tell you that this indicator is giving me important insights into the strength of the market’s overall risk appetite.
If you are ready to make your next side hustle trade, I urge you to come see how I am using my 20+ years as a trader and market educator to position RIGHT NOW.
As one of Inc.’s most TRUSTED educators, I hope you’ll recognize the value in how I help folks like you plan and place trades in a way that fits your lifestyle.

Over the past two years I have seen many of my Market Navigator members take on trading as a side hustle, with all the extra time they’ve found with their new hybrid working arrangements.
As an innovator in this industry, RagingBull has THE BEST platform for getting trade ideas in front of retail traders from every angle, at all hours of the day.
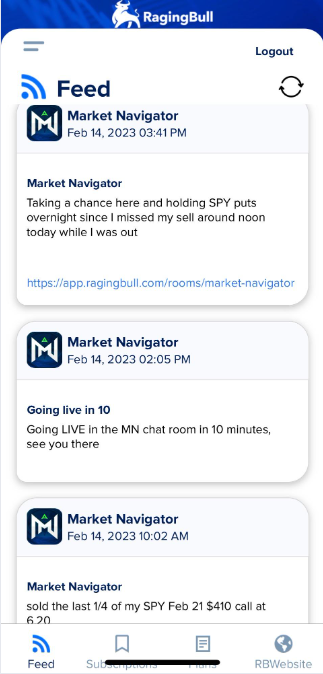
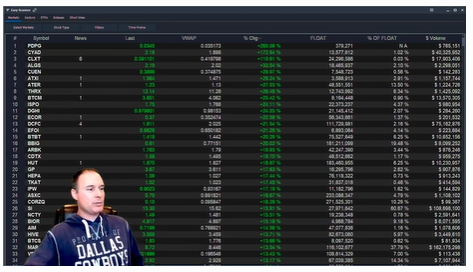
Just look at this SMALL sample of alerts that came from my Market Navigator service alone yesterday:
From instant app alerts…
To the LIVE chat room…
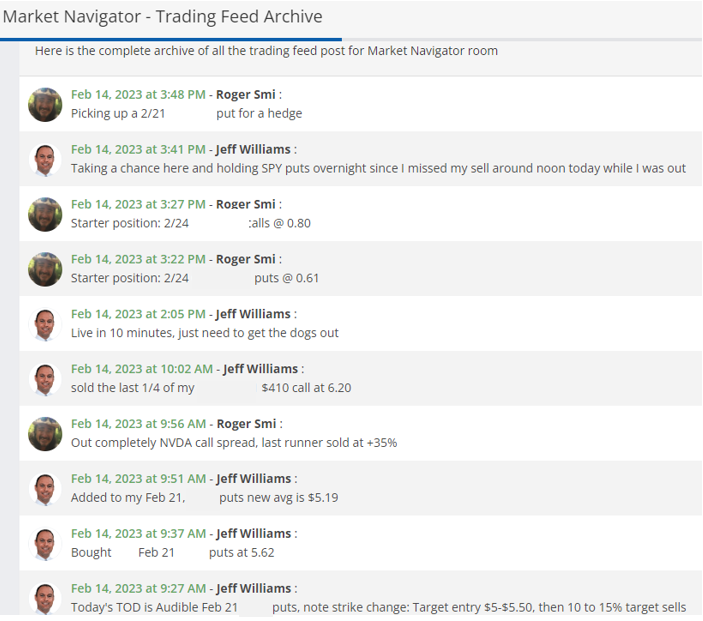
To the Market Navigator trading feed…
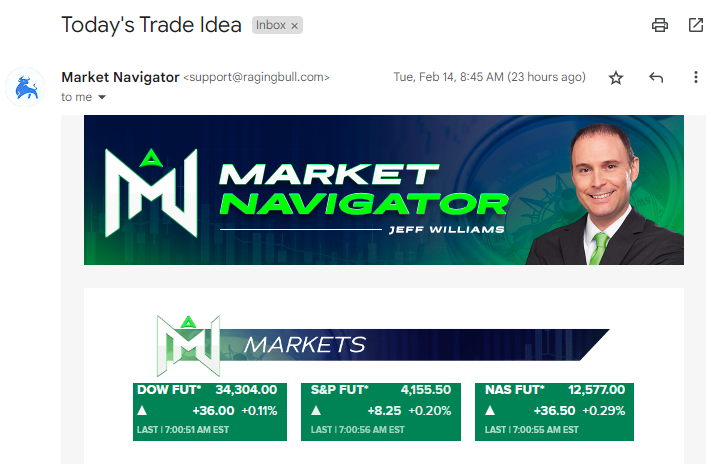
To non-stop email alerts…
Even if it’s for one trade a day during your busy schedule, there is always an opportunity to quickly take the plan I have hand-crafted for you and execute on it.
I beg you, don’t be another retail trader that falls victim to HORRIBLE market timers like Jim Cramer.
I’ve been trading for 20+ years, and I am about to drop my next trade idea based on what I am seeing in the market’s risk appetite.
Access to EVERYTHING you need to get started is right HERE!
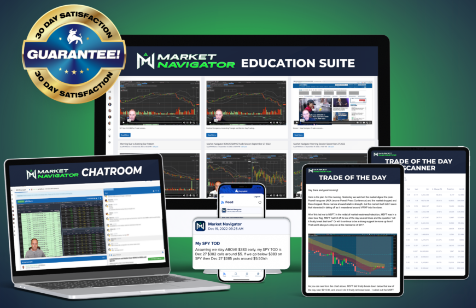
I’m not holding anything back.
Every Trade of the Day comes with a 30 minute “HeadsUp” and can be made from your phone.
So if you do have a smartphone, I have your trades of the day…
Easy as that. Don’t miss another day – start your trading journey with me TODAY!
Now and then, a special opportunity arises.
A chance to make a decision that can have a lasting impact.
Here’s the opportunity.
I will be hosting a LIVE event with Jason Bond in just a few hours.
This is your opportunity to hear from not one but TWO penny stock gurus right here at Raging Bull.
In this special Livestream event, Jason and I will be discussing what’s been working for us, how we are navigating the current market, where we think this market is headed…and more!
Since Jason and I began trading penny stocks, our strategies have evolved, along with the ever-changing market.
However, one thing that has stayed the same is our love for trading penny stocks.
Even though we are often involved in the same stocks, we have our unique strategies and way of trading them!
Jason and I both traded MULN when the stock was in play earlier this year and experiencing upside momentum.
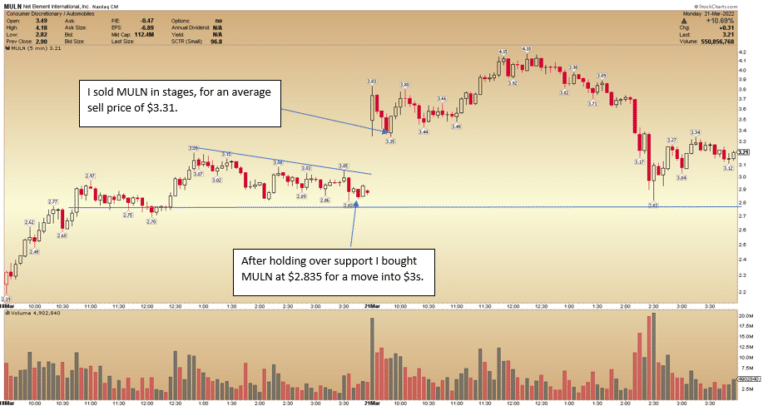
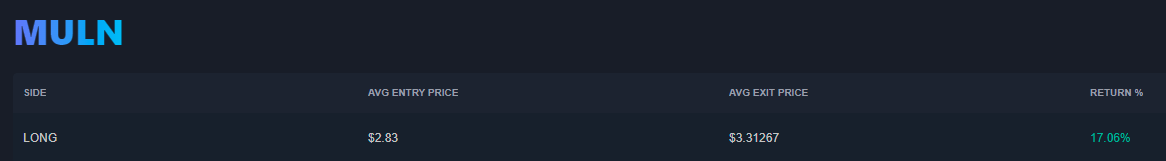
I got long after noticing the stock was holding above previous resistance, and momentum was still firm to the upside.
I sold my position in MULN for a 17% return.
About three weeks earlier, Jason traded MULN as well.
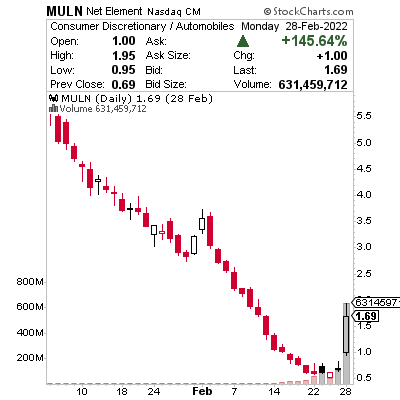
He traded the stock on February 28th, as the stock was gapping higher in the pre-market and trading above the previous day’s close and resistance.
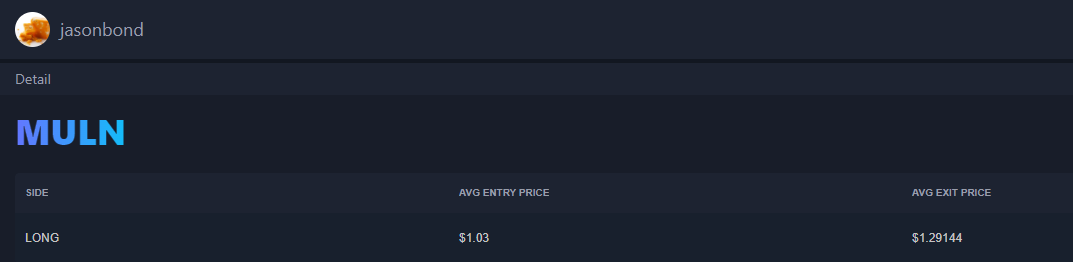
Jason got long MULN in the pre-market, at $1.03, as the stock was trading above the previous day’s consolidation, appeared to have broken the downtrend on the daily chart, AND was trading above $1.
He sold his long for an average price of $1.29, representing a 25% return.
So what are you waiting for?
Now’s your chance to hear from Raging Bull’s two penny stock kings and gurus.