The SPY is coming off a week where it gained nearly 2% as markets look to rally off a 3-week losing streak.
With a week of heavy economic data coming up, I’d like to share with you my single favorite indicator I use when day trading the SPY during volatile market conditions.
Besides using this ONE indicator to help me with my entry and exits on the SPY, I also love how I can see market data coming up and then prepare my trades around that. It’s one of the unique aspects of trading the SPY or S&P500 that stock traders don’t necessarily have. Being able to see the pitch coming a day or two in advance can really help give me an edge on my trading.
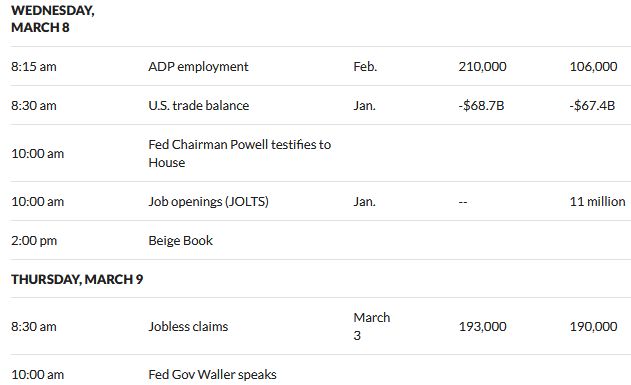
For example, I see that Wednesday and Thursday have some really high impactful pieces of market data. ADP employment (or the change in private employment) is coming up before markets open Wednesday. Fed Powell speaks that same day at 10AM, followed by Job openings and then Jobless claims on Thursday.
How can we not forget about Fed Waller on Thursday??? His last live event ended “prematurely” when he supposedly got hacked and started to stream porn (or something along those lines!)…
Either way, seeing these softballs being lobbed ahead of time allows me time to prepare for the next day or two. This might keep me from taking overnight swing trades in hopes of protecting my capital where some traders might hold blind and wake up to a total market mess.
That being said, I LOVE volatility. I mean isn’t that what most traders want? I think it’s safe to say most of us don’t trade speculative stocks with the goal of holding them for 1 year and seeking a return of 2% – boring to me, at least!
So, once I spot a trade setup I like, what’s my #1 indicator to help guide me in my entries and exits?
Bollinger Bands.
Take a look at this chart from last Friday the 3rd of March. You see the thick solid blue lines on top and bottom of price action (look like clouds) and the dotted middle line running up the middle? Those are the bollinger bands. They essentially represent volatility.
Here is how I use them. When the price action is above the dotted middle blue line (which is simply the 20 SMA) I like to buy calls on SPY. If price action is below the dotted middle blue line then I like to buy puts.
Assuming the price action stays above the middle dotted blue line, I might look to stay long my calls, maybe “trim and trail” meaning sell some to protect capital and reduce risk or maybe sell all and move on. Once the candle drops below the dotted blue line then I might consider selling and moving to a new trade.
Friday was a great example of price action staying ABOVE the dotted middle blue bollinger line almost the entire day, right up until about 3:30PM where I circled in red the price action finally falling below the middle bollinger band.
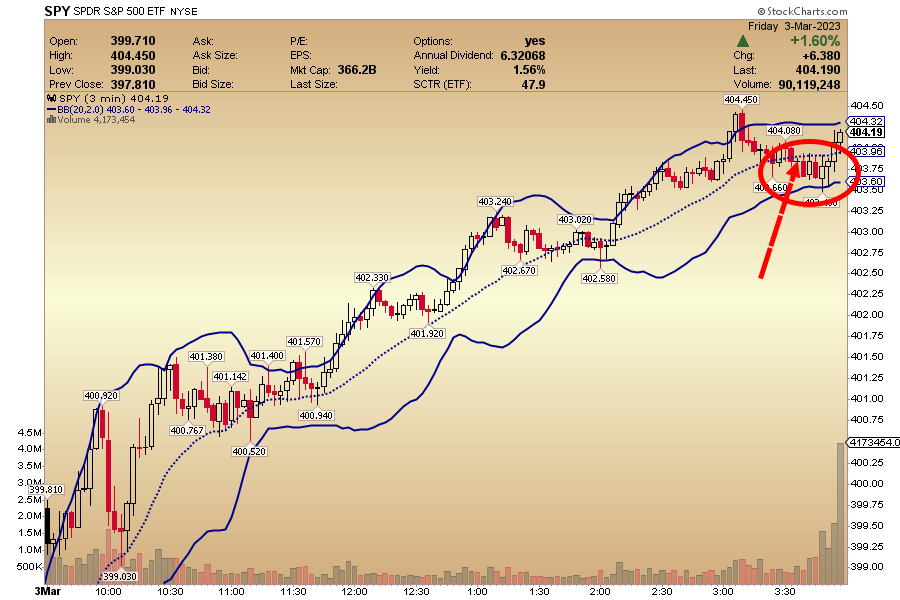
Think about that for a moment. Had I only used the middle bollinger band, I really didn’t get a sell signal until right before the close. I had a shot at a near $5 move on SPY, amazing!
I use these bollinger bands mostly on 1 and 3 minute charts during the day. I often will look for price action to be BELOW the middle bollinger band then look to buy if we cross above that line (my signal line) and then target 10 to 20% or trim and trail if the trade appears to be working for a while like Friday’s chart showed.
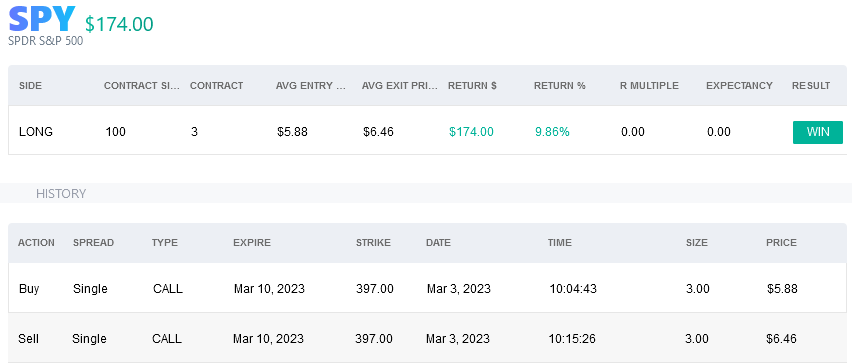
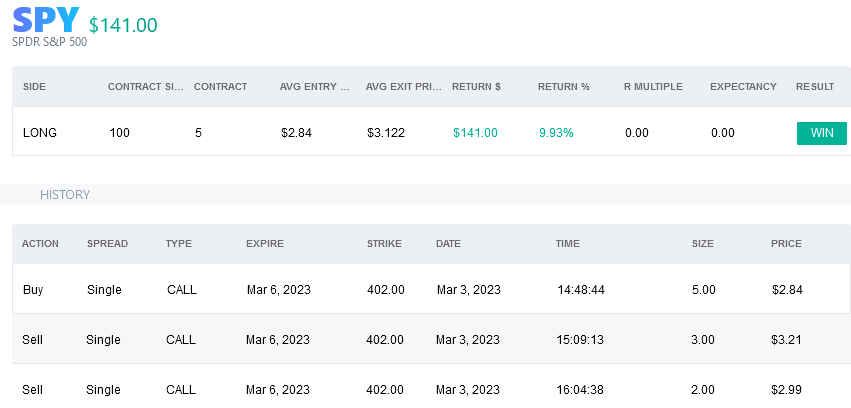
Matter of fact, I used the bollinger bands to make 2 trades on the SPY Friday. One in the morning on the dip and one in the afternoon before the fall late in the day. You can line up the times of the images below with the chat above and you’ll see how I bought the dips and sold the rips higher.
While I never recommend using just ONE indicator nor will I say the bollinger bands help me win every trade, I do feel they are a great simple to use indicator that can surely help guide me in making more educated, real time entries and exits and that’s all I can hope for.
If you would like to learn more about my trading techniques or actually watch me trade live during the day, I am offering a $1,000 savings right now to my flagship service Market Navigator.
I’ve taught thousands of traders just like you over the last 12 years (click HERE for reviews) and I am confident that I can teach you a lot about markets and how they work (click here for my trading record).
So…I’m hopeful you’ve learned something today…
And if you’d like to learn MORE, simply click here to see how you can pocket $1,000 now yet still get a full learning experience with me.