How to Read Option Prices
Reading option prices takes a bit of getting used to, but even beginners find that it doesn’t take long to catch on to what they are seeing. Without being able to read option prices accurately, option traders might not clearly understand what they are getting into, or how much money they might put at risk.
This part of the beginners’ guide will help you get a basic understanding of how to read option prices from a broker’s quote screen. Keep in mind that the illustrated examples are hypothetical prices only. Option prices are usually displayed in a format that looks something like this illustration:

This is what is known as an option chain. It is a table of prices that organizes options by strike price and expiration date so buyers can locate the exact option they need. It is important to understand that the data in the option chain is interrelated. The following illustration will identify each of the six most important elements an option buyer would need to know. Let’s walk through these elements one by one.

- The current stock price
This price fluctuates as the stock price rises and falls. On broker’s platforms, the option prices will change in real time as they adjust to any changes in the stock price. It is important to understand that the option prices you are looking at in the option chain are always based on the last published price of the stock. - The expiration date of these options
Brokers platforms will show a separate table of option prices for each available expiration date that options are offered. New groups of options with a new expiration date are created as previous groups expire. - The option type (whether call or put) Calls give the right to buy, puts the right to sell. Calls are always listed on the left side of the table and puts are always listed on the right.
- The strike price of each available option
This is the price where an option buyer has the chance to own shares (calls) or sell them short (puts). The more heavily traded a stock is, the greater the number of different strike prices that are likely to be available for option traders. - The bid and ask prices for each option
When a trader wants to buy an option, they look at these prices. The example here is the 100 strike price, and if a trader wanted to buy that option, they would usually have to pay the ask price. In this example the price is 5.00 per share. Since option contracts usually include 100 shares of the stock, the price for this option is $500. If the buyer wanted to sell the option immediately after buying it, they would need to accept the bid price. In this example that price is $4.90, so buying the option at $5.00 and selling it at $4.90 represents a ten-cent transaction cost. When that ten cents is multiplied by one hundred shares, it amounts to a difference of ten dollars. This transaction cost is in addition to any commissions the broker might charge. - The Strike price closest to the current price of the stock
In this example, the $100 strike price is the closest to the last traded stock price. This particular option is referred to as being “at the money.” Option traders look for the at-the-money option when they want the most efficient balance between cost and leverage.
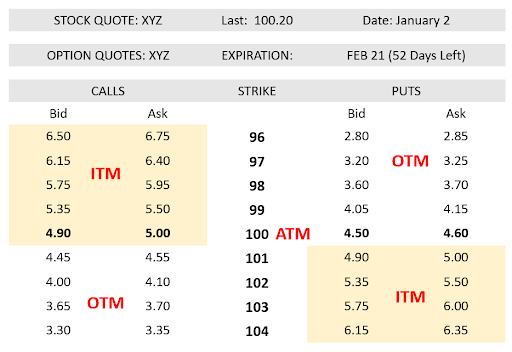
In addition to the state of being at the money (ATM), options can be either considered “in the money” (ITM) or “out of the money” (OTM). Calls are in the money when they have a strike price below the current price of the stock and puts are in the money when they have strike prices above the current price of the stock.
The state of being in the money comes from the value a trader gets if they choose to exercise their contractual rights. Call option buyers have a contractual right to buy the stock, so a strike price below the current price means they can get the stock for below market rates. On the other hand, put option buyers have the right to sell stock. So if a put option trader can initiate a short sale on the stock with a strike price that is higher than current market price of the stock, then that put option is in the money. The illustration previously shown labels the options in each of the following states.
ITM:
The options in the shaded area are in-the-money because they have value if exercised at the current stock price. As the stock price rises enough to cross through strike prices, these strikes become ITM. Put options become ITM when stock prices fall below the strike price. All option data providers will highlight these options.
OTM:
The options not shaded are out-of-the-money because these options have no value if they are exercised at the current stock price. Call options become OTM if the stock price falls below the strike price. Put options become OTM if the stock price rises above the strike price.
ATM:
This is the strike price closest to the current price of the stock. Note that this option may also either be ITM or OTM. In this case, the 100 strike price is ITM for calls and OTM for puts. This option more sensitive to stock price moves than any OTM options, but less expensive than any of the ITM options.
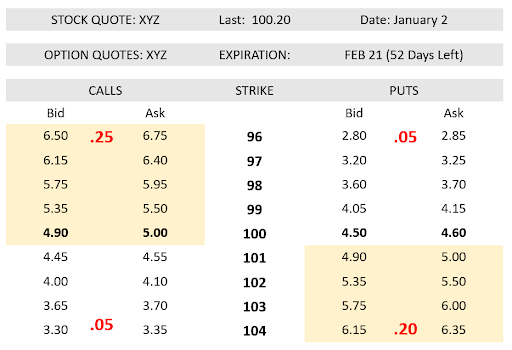
Option contracts are created and sold by market makers in response to demand. When these options are created, the market maker sets the price. Changes in an option’s price are driven by the normal market action of buyers and sellers, but also by movement of the stock price and the perception of investors. Market makers are constantly publishing new bid and ask prices for all of the option contracts they offer. They compete with other market makers and this competition is good for option buyers because it creates more efficient pricing on the option chains.
The difference between what buyers pay to secure their contractual rights and what sellers get when entering into the contract is known as the bid/ask spread. The size of the gap between the bid and ask prices is not the same for every option. Generally this size of this gap is affected by two things:
- ITM or OTM. The bid/ask spread is tighter for OTM strike prices than OTM ones.
- The liquidity of the option. More popular and heavily traded options have tighter spreads, while less popular and less liquid options have wider spreads. Compare the example of the hypothetical prices for XYZ options (previously shown) and ZYX options (following illustration).
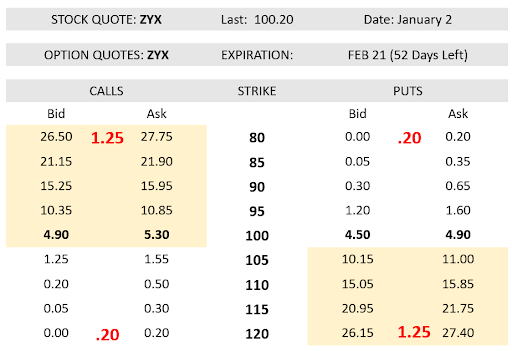
In this hypothetical example of an option chain for ZYX stock, the prices are depicted as what might be typical for a stock which is less popular and therefore less liquid than XYZ stock. The option chain looks very similar except for two things:
- The bid/ask spread for each contract is much wider. This wider bid/ask spread is an indicator that fewer option traders have chosen to speculate on price moves in ZYX stock.
- The gap between the strike prices is also further apart indicating a lack of trader interest in ZYX stock compared to XYZ stock.
Watching the gap between the bid and ask prices and the strike prices is a useful detail for a trader to notice. As either of these widens, the transaction costs for these options increases adding additional risk to the trade.
There is a lot more to learn about what can be read from option prices, and brokers include additional information beyond that captured in these examples. For further study on what else can be learned from reading option price data, be sure to review this article: “Reading Options Quote Information.”
Being able to accurately review option price information helps a trader more effectively approach the market as either a buyer or a seller of options. The next part of the Beginners Guide introduces the concept of trading approach and helps explain why traders might approach option trading in different ways.


