
At the end of each quarter I put together a list of stocks I have my eyes on.
And while, while the quarter is not over yet, I’m really excited about these five names. (Spoiler Alert: none of these are meme stocks, yet at least).
Three of these stocks I like as longer term swing trades. The other two could be worthwhile in the short term.
In a few moments, I’ll share with you what these five stocks are, why I like them, as well as my temporary game plan for them.
ELAN
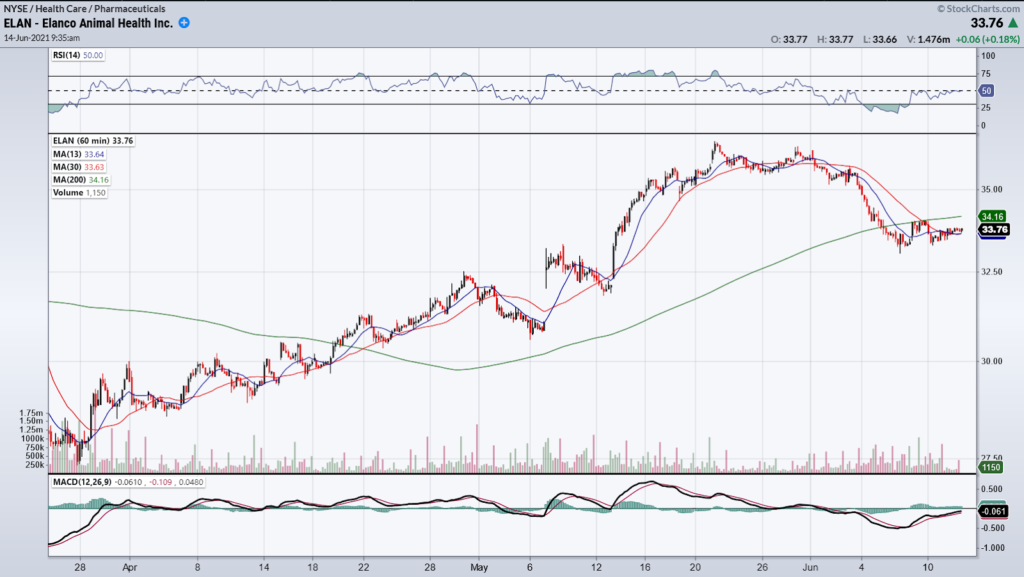
This stock is consolidating under the 200 hourly support average with the 13/30 hourly momentum averages coiling around the price.
Right now there is a shorter term base being established near the $33 price, and the recent pivot low seems to hold the price at this level. If the Higher High/Higher Lows can re-establish an uptrend, I expect prices to break above the 200 hourly moving average and continue to trade higher.
My Trade Plan: Right now I want to keep an eye on the Higher Low that was put in along with how the price acts at the 200 hourly moving average. If this level is held and the stock makes a new HH/HL, I will start to look for a place to enter this trade on a pullback. My target price is back to the pivot high near $36 (or higher).
ANGI
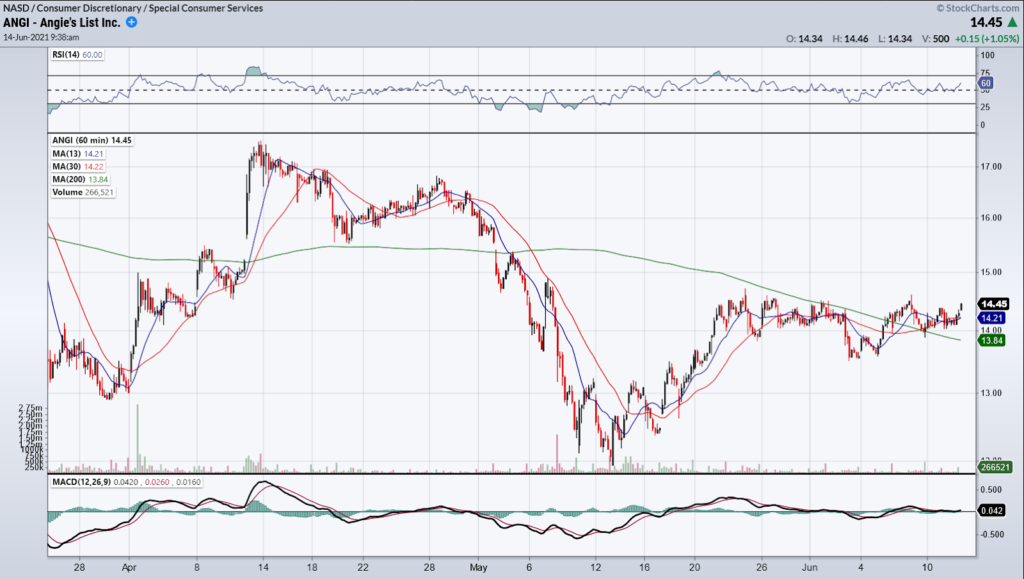
This stock has been consolidating around its price near $14 since the end of May. It is currently forming a symmetrical triangle between its recent pivot high and pivot low around the 13/30 and 200 hourly moving averages. If the 13/30 hourly momentum averages can support the stock, the higher high around $14.50 can easily get broken for prices reaching for $15 at the next pivot level.
My Trade Plan: I want to keep an eye on the $14 pivot level. If this stock can make a new higher high and higher low staying above the 200 hourly support level, I think the stock can trend higher and get back to $15 or more. I will be looking to buy this stock on a pullback instead of chasing it higher.
IPW
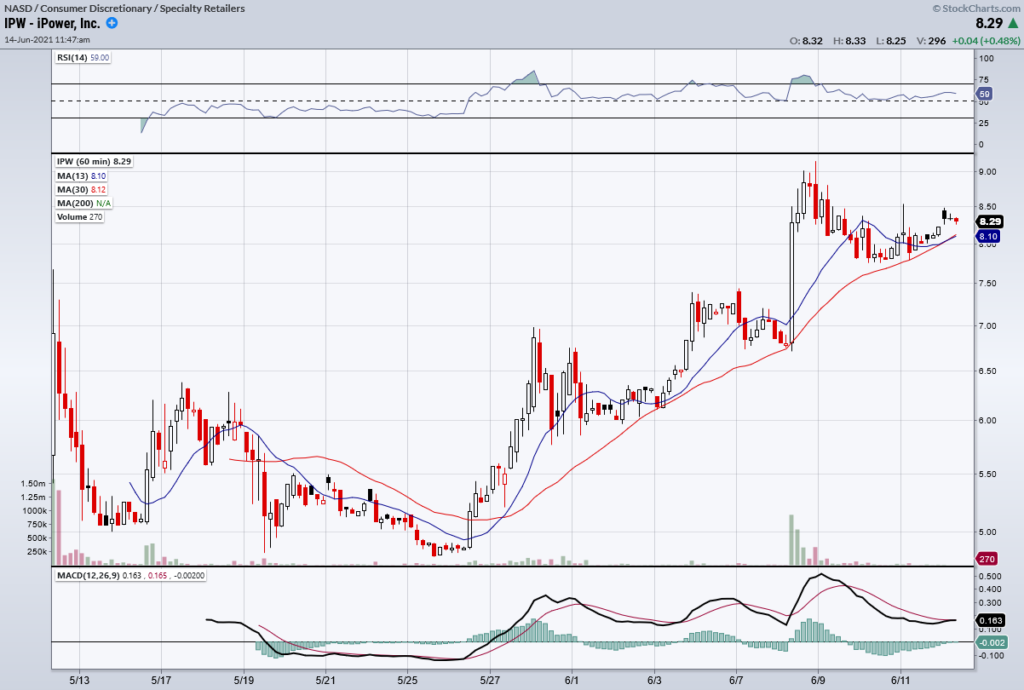
This stock is forming a bull flag with the 13/30 hourly momentum averages acting as support. Over the last 3 bull flags that were formed, these averages continued to push the price of the stock higher. I am expecting similar price action at the 13/30 hourly moving average now that it has pulled back, with a target of $9 or higher.
My Trade Plan: When trading bull flags, I don’t typically like to chase the breakout higher. As you can see from the last 3 bull flags that occurred, the breakout usually leads to a pullback that forms another bull flag. So what I want to see is the 13/30 hourly moving averages continue to act as support, and get the stock to drop down to these levels. If this happens I’ll be looking to buy the dip in this name as I think it can break out past $9
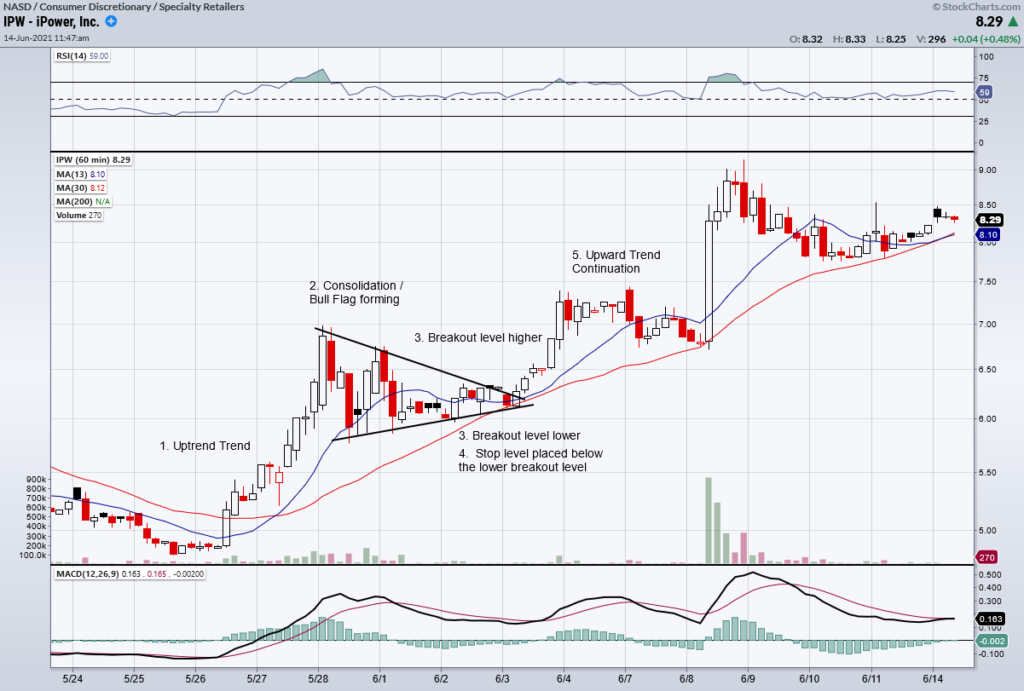
Trade Lesson: Bull Flags
These are one of the easier patterns to spot when looking at a stock chart. There are 5 main characteristics of a Bull Flag that you need to remember:
- What is the prior trend
- Identify the consolidation channel
- Identifying the breakout levels
- Locate where you are going to place the stop on this trade
- Confirmation of trend continuation
SNOW
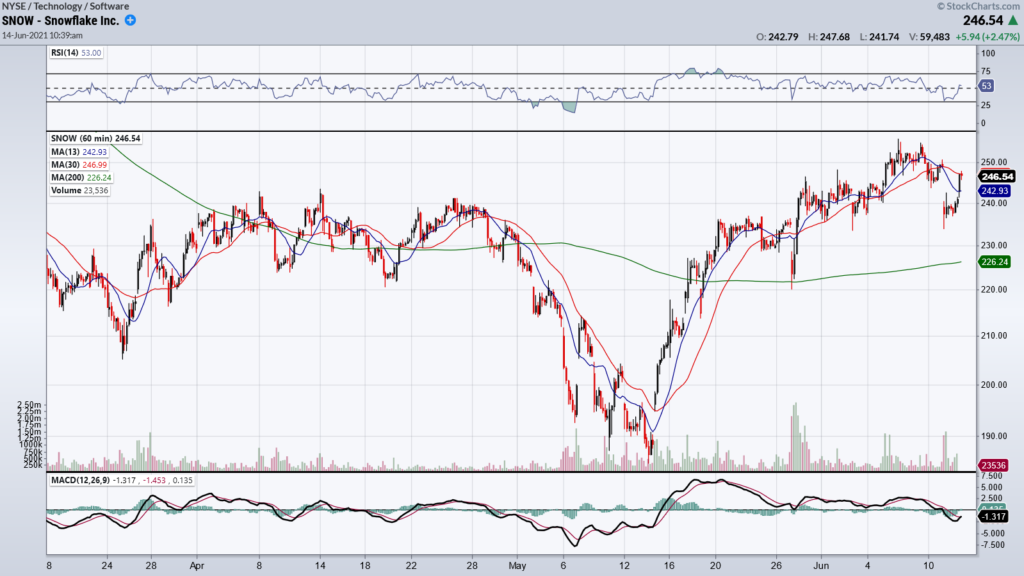
This stock took a little bit of a hit the other day, trading down below $240 before quickly bouncing back higher. I believe that this stock will trade in a large range with increased volatility for this upcoming week. Technically, SNOW needs to trade higher than $250 in order to turn the resistance level into a support level in order for higher prices to be seen in this name. Once this happens, I’ll be looking for a HH/HL pattern to form to confirm the uptrend is being held.
My Trade Plan: I plan on selling a put credit spread if SNOW takes another dip and continues to hold the pivot low around $240. If the stock breaks out higher than $250, I will look to sell put credit spreads using this level as a support price for the stock.
LOVE
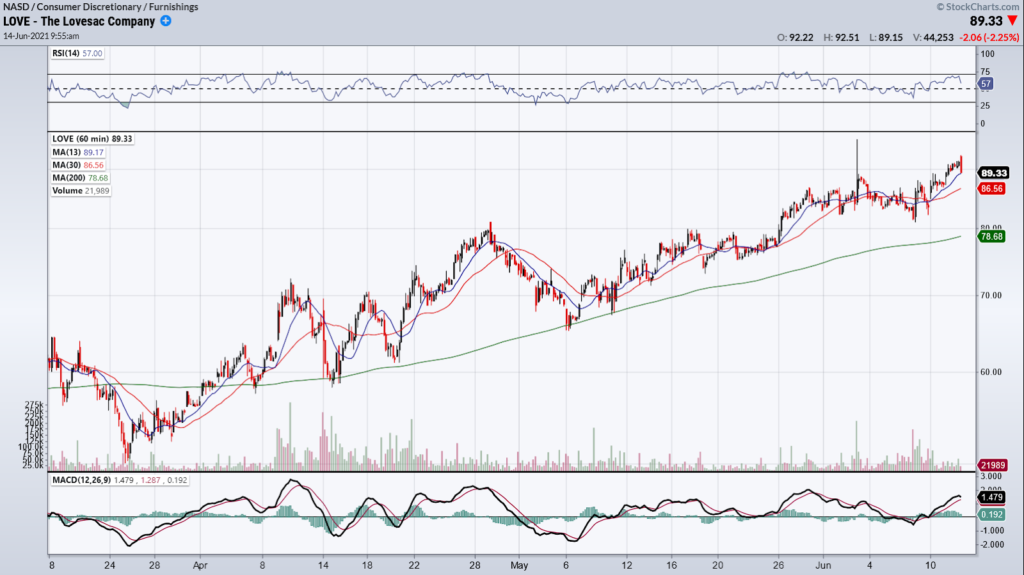
This stock has been on a tear since March, with a very clean Higher Highs and Higher Lows (HH/HL) pattern in place. I expect that there will be buyers at every dip and down at the 200 hourly support average as well. Right now I want to keep an eye on the 13/30 hourly momentum averages for price to continue the uptrend at this time.
My Trade Plan : This stock has been in a strong trend with buyers at every dip. I am going to start to look for dips in this stock where I can sell a put spread at resistance levels. Right now, I would like to see a dip back down to $85 so I can sell a put spread below the pivot low and 200 hourly support level near $80.


7 Comments
Thx Sir!!
Super excited to see you guys are back
I hope this will be shown in bulls eye trade as i always follow. More power
This is great, I have been looking for a mentor.
Thank you,
yes to whom it may concern
I have several stocks but I’m confused about the HH/HL patterns maybe I could use this to my advantage. Also the hourly momentum. I would be much appreciative in learning these ideas as I could use on my own investments.
Thanks
Plaxsis
Hey I am so thrilled I found your weblog, I really found you by error, while I was researching on Aol for something else,
Nonetheless I am here now and would just like to say
thanks a lot for a tremendous post and a all round thrilling blog
(I also love the theme/design), I don’t have time to browse it all at the moment
but I have saved it and also added your RSS feeds,
so when I have time I will be back to read more, Please do keep up the fantastic job.
Hi, I do believe this is a great web site. I stumbledupon it 😉 I am going to return yet again since i have book marked it.
Money and freedom is the best way to change, may you be rich and continue to
help other people.