On September 9th, I wrote about CEI, as the week before the stock traded massive volume and gained attention online.
I discussed the teachable moments in the stock, the substantial risk: reward entries that existed, and how the stock might have been traded.
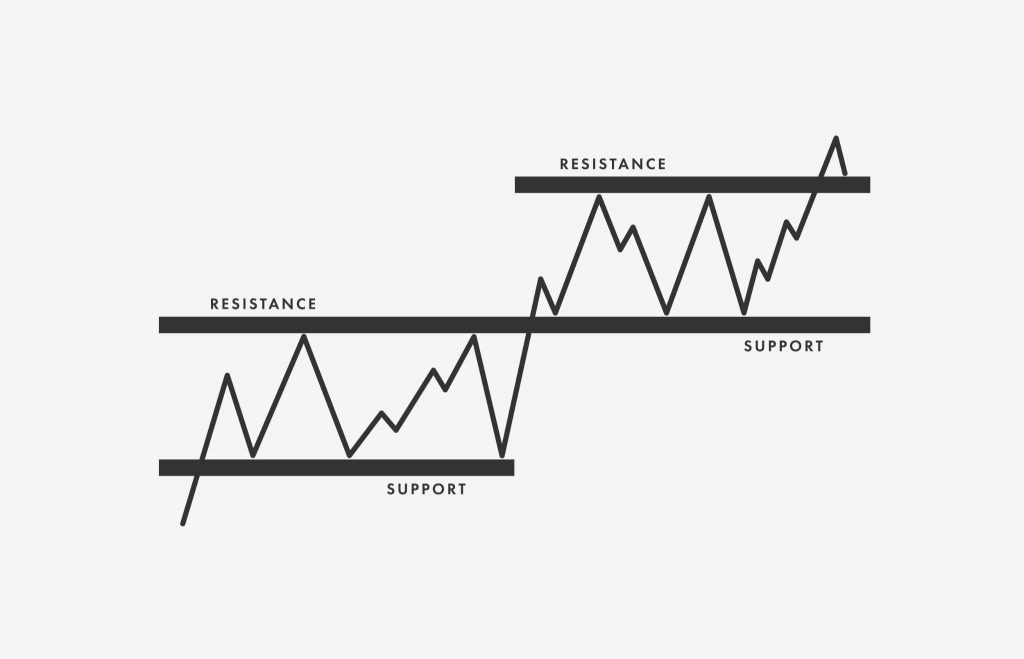
I also identified vital support and resistance levels and provided my thoughts on where the stock could trade if the resistance were broken.
The levels and plan which I outlined were spot on.
However, now that the plan I put forth last week has primarily played out, what’s next for the stock? And can it continue to rise?
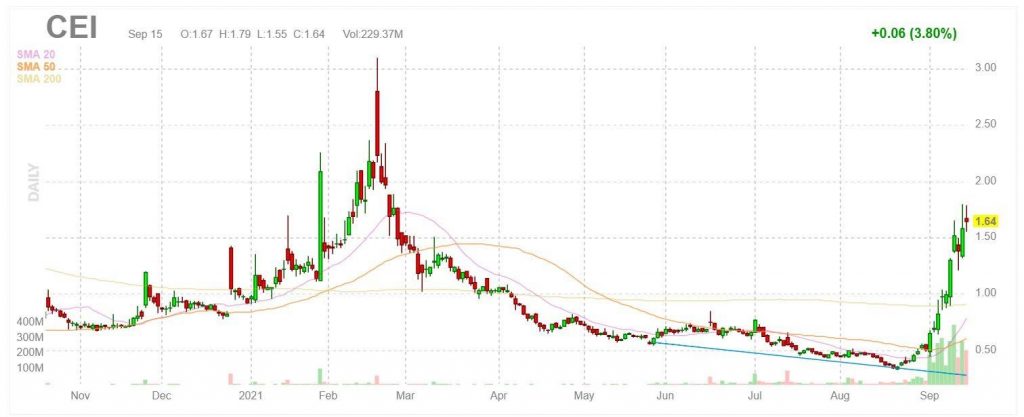
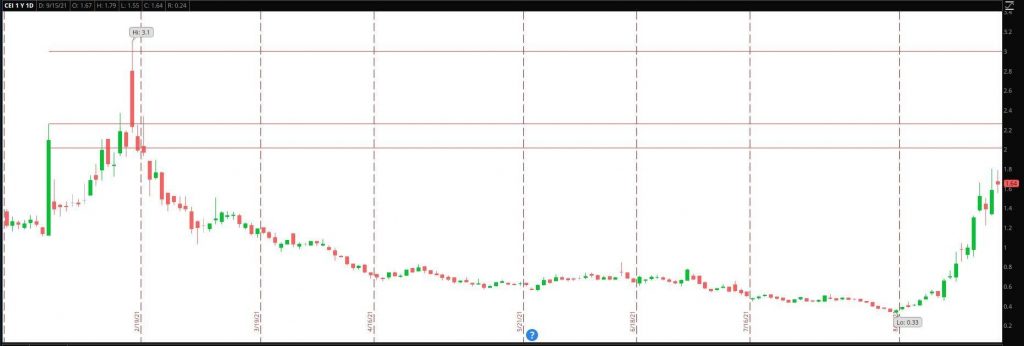
Before we get into the finer details, let’s glance at the move that has occurred so far in the stock.
On the month, as of yesterday’s close, CEI is up over 315%. Just this week, the stock is already up over 65%.
Fundamentally, no significant news was released, which caused shares of the company to soar this month. Instead, abnormal volume and enormous interest from retail trader’s online social media platforms have driven the move.
When I last wrote about CEI, the short interest was at 14.26%. Now, according to Finviz, the short interest has jumped to 24.56%. This is good news for the bulls.
New Levels of Support and Resistance
The previous resistance levels, as per my original article, were:
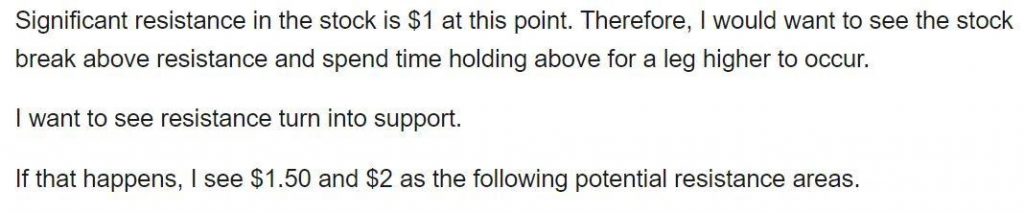
As soon as the stock broke above $1 last week, it broke away from that critical level and was able to hold above firmly.
$1.50 was the next critical level of support. The stock broke through this level and based above, thereby turning it into support.
The following key level of resistance was $2, which is yet to break.
In the future, the previous levels of resistance will now act as support.
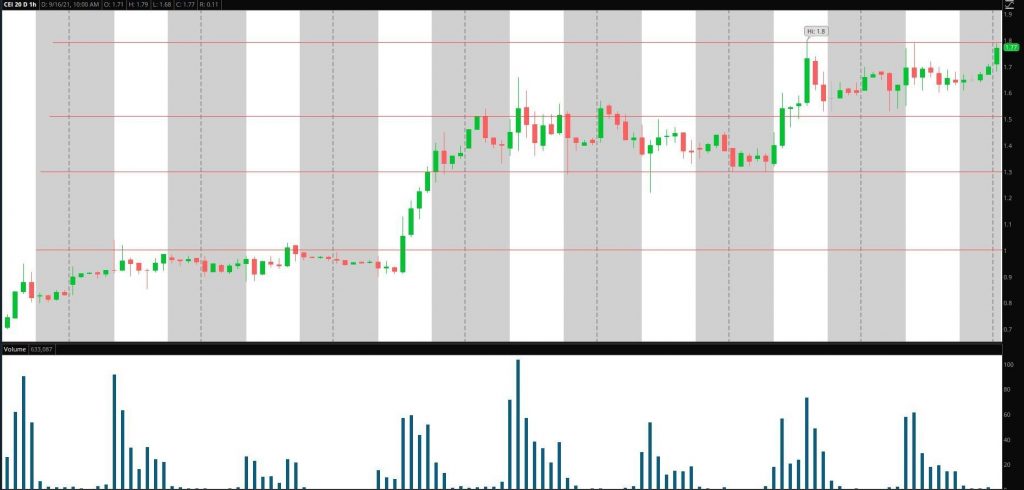
For today and in the future, the bulls will want to see the stock hold above $1.50 if it were to experience a pullback. This level was previously resistance.
If that price is unable to hold, then $1.30 will be the next crucial level of support. The stock spent two days consolidating above $1.30, with that level acting as support.
Where could it be heading if the stock breaks above the high and resistance from the previous two days ($1.80)?
The first key level is $2. This is a huge psychological level. If the stock can break above and hold above, it could signal that it is heading higher, much higher.
The next level of interest is $2.25 – $2.50, taken from the daily chart. This is a crucial area of interest as previously, the stock traded to this area and failed. Bulls will want to see the stock comfortably hold above this level.
Perhaps the most spoken about target price is $3. From a technical standpoint, this makes sense as $3.10 is the stock’s 52w high.
However, this level has become an unofficial stock price target by many retail traders online various social media platforms.
The Bottom Line
This stock has respected critical levels exceptionally well and continues to put in higher lows. This action could signal that the run is not over.
I have seen what is possible when the retail trading crowd gets behind an idea, especially a stock with growing short interest. GME, AMC, CLOV, and FCEL are just a few examples.
So if this stock continues to trade impressive volume and trade over resistance, $3 might be possible. Below crucial support levels, however, the narrative and momentum could change.

Leave your comment
Related Articles:


1 Comments
Wow, thank you for that detailed break down. Can you explain what short float is and how it applies to the market please?