
Last week CEI started gaining the attention and imagination of many traders online through various social media platforms.
As the attention grew more prominent, so did the volume.
What has since transpired in the stock is a significant move higher, the abnormal volume being sustained, increased mention of the stock online, and a number of textbook trading setups.
With that in mind, I want to go over how the initial move played out and look at what’s next for the stock.
First of all, What is CEI?
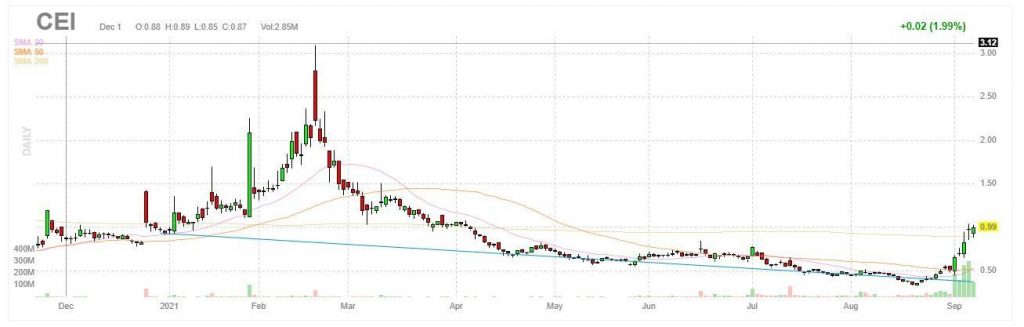
Camber Energy (AMEX: CEI) is an independent oil and natural gas company.
The company engages in acquiring, developing, and selling crude oil, natural gas, and natural gas liquids.
CEI was incorporated in 2003 and is based in Houston, Texas.
Market Cap: 62.73M
Float: 25M
Short Interest: 14.26%
ATR: 0.09
Average Volume: 32.45M
What was the catalyst?
Despite no significant or fundamentally changing news, CEI stock has been rising sharply over the last five trading sessions.
As I mentioned above, the attention surrounding this stock has continued to grow larger online. Retail traders clung to this stock last week, as CEI was widely mentioned across social media platforms as the next potential short squeeze.
I mean, it certainly met the criteria for a short squeeze. The stock has a small float of just 25M shares. The stock also has a decent short interest and a low price. It seems that these were all attractive points and that they boded well with the retail trader who was looking for a stock to squeeze higher.
The Teachable Moment
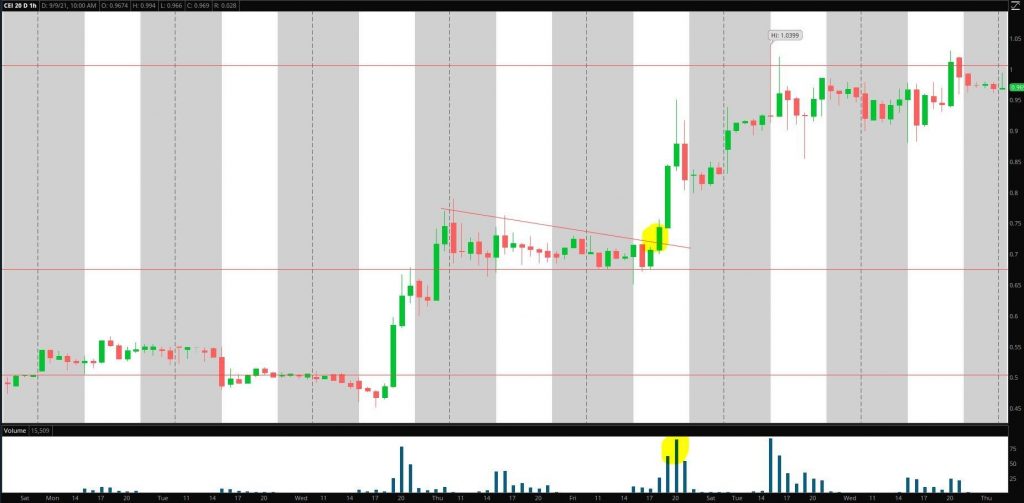
Last week Wednesday, the stock broke out of its downtrend and saw a sharp, rapid rise in price and volume throughout the day.
I think on day one of the move, unless you were actively watching the stock trade, it would have been challenging to get in at reasonable prices from a risk: reward point of view.
Resistance and the high from day one of the move was $0.68.
The following day the stock mainly traded between $0.72 and the previous day’s resistance of $0.68.
What stood out to me was that resistance had now become support. The stock was not able to get below and hold below this crucial level.
This is a sign of strength and signaled that bulls were firmly in control.
On day three, a fantastic trade opportunity came when volume increased, and the stock broke above the bullish pennant.
Notice, where I have highlighted on the chart, how the volume sharply increased when the stock broke above $0.72.
If you spotted that setup and got long, there was an opportunity as the stock approached $1, as that is a significant level of resistance.
This setup is a great risk: reward opportunity.
What’s next for the stock?
Resistance: $1
Support: $0.90, $0.85, $0.80, $0.70
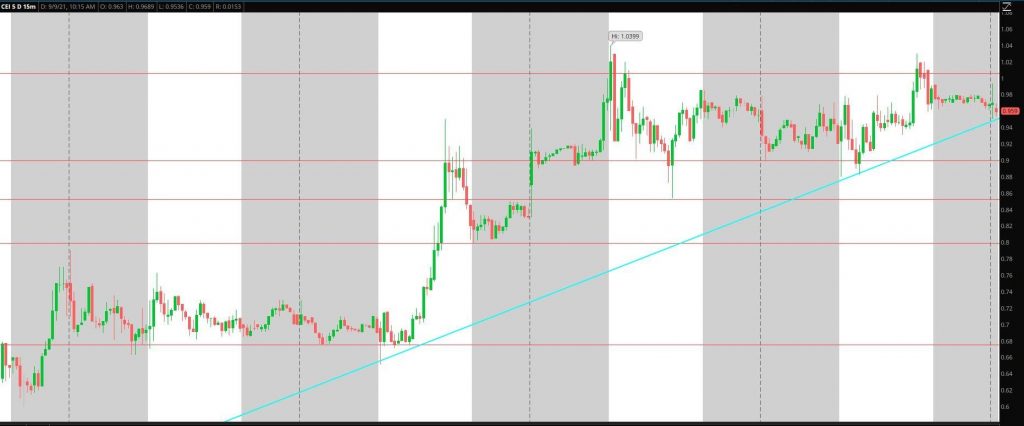
The upward trendline from the start of the move would be broken if the stock got below $0.94. However, this would not worry me as it is healthy for stocks to pull back and digest large moves before continuing higher.
Essential support can be found in the stock at $0.90, where support has been for the last two days.
Below that level, buyers will need to protect $0.85 and $0.80. A pullback into those levels met with buying could be seen as a healthy pullback.
If the stock fails to hold those levels and breaks below $0.70c, I would no longer be bullish on the name.
Significant resistance in the stock is $1 at this point. Therefore, I would want to see the stock break above resistance and spend time holding above for a leg higher to occur.
I want to see resistance turn into support.
If that happens, I see $1.50 and $2 as the following potential resistance areas.