
I’m excited to share my trade plan and thoughts with you today.
Sometimes I find a setup that is just picture perfect.
I am not saying it will be a winning idea or the perfect trade.
No, I mean that it is, technically speaking, a beautiful chart pattern straight out of a textbook. As a result, this makes for a great teaching and learning opportunity.
I am excited to share the chart and trade plan with you, and I’m just as excited to dive deeper into the technical analysis and talk about the specifics of the chart pattern.
I want you to understand the pattern and technical analysis because setups and charts repeat themselves in the market.
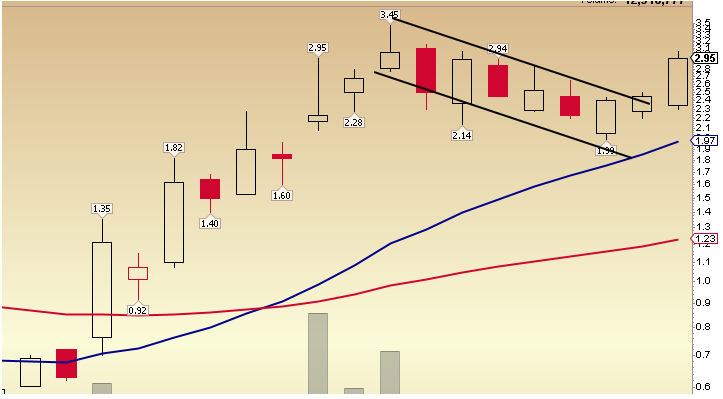
What is a Bull Flag?
A bull flag forms in a stock that is in an uptrend. Think of that uptrend as the ‘pole.’
Then, near the highs of the short-term uptrend, the stock consolidates and forms a flag pattern. Think of that as the flag on top of the pole.
This pattern might signal further continuation in a stock, especially if the stock breaks above the flag’s resistance.
The above bull flag example is a screenshot of the stock on my watch list.
I told you, gang, it is a textbook example of the bull flag pattern!
So, without further ado, let’s get started.
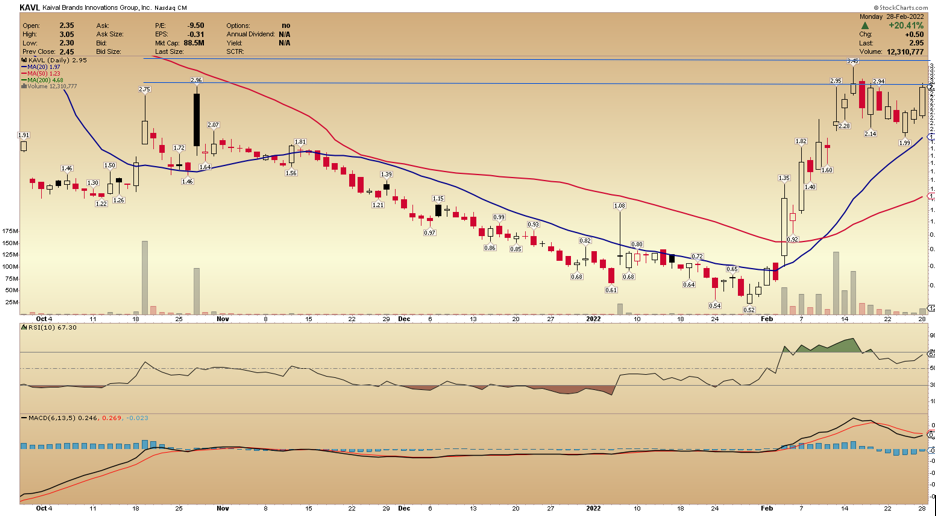
Kaival Brands Innovations (KAVL)
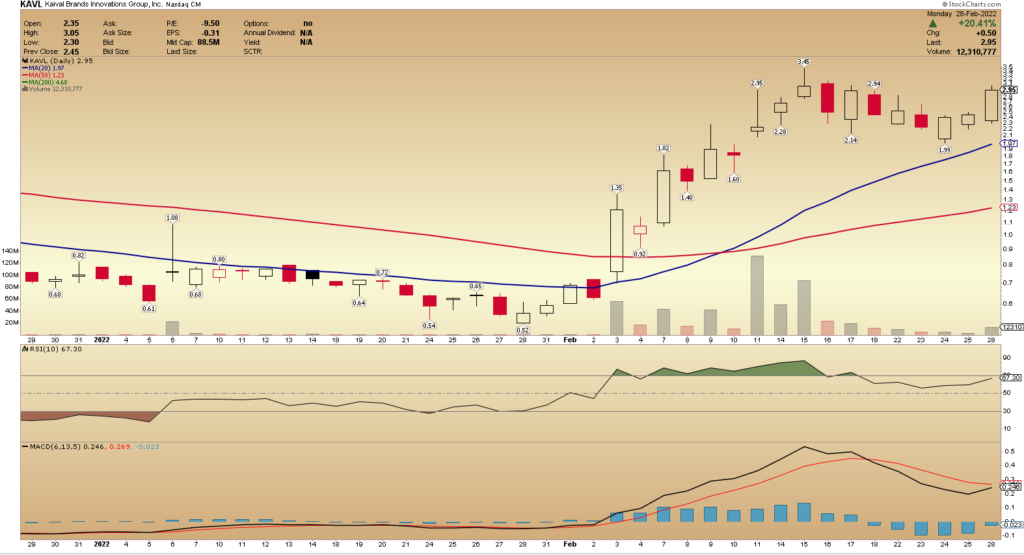
The above chart, from stockcharts.com, shows KAVL over two months.
In that period or year to date, the stock is up 295.81% and was up 431% last month, according to Finviz.
Those are some pretty hefty stats, and they correspond with the chart.
Since breaking out above $0.80 last month, the stock has not looked back and reached a short-term high later in the month of $3.45.
What is KAVL?
According to Yahoo, KAVL distributes electronic nicotine delivery systems (ENDS Products) and related components in the United States. The company offers Bidi Stick, a disposable and tamper-resistant ENDS Product in various flavor options, and Bidi Pouch, a tobacco-free nicotine formulation containing natural fibers and a chew-base filler in different flavors.
Key Stats, from Finviz:
Market Cap: 87.4M
Float: 13.15M
Short Interest: 26.70%
Average Volume: 9.36M
One thing that stands out to me from the above stats, gang, is the short interest.
The short interest of 26.70% is high.
That means that 26.70% of the 13.15M float is positioned short right.
Bulls might like that stat because it could mean that if the stock continues to push higher, the chances of a short squeeze become more likely.
It looks like the pullback from the high and the bull flag pattern might have finished developing, and the stock is now attempting to have another leg to the upside.
I am keeping it straightforward with my thoughts and game plan here, gang.
First, I want to see the stock hold above yesterday’s high.
Secondly, I want to see the stock break above $3 and, importantly, hold above that level.
If the stock can do that, I might enter a long position and target $3.50s conservatively and a more ambitious target of $4.
The Bottom Line
This stock certainly has the look, in my opinion.
However, there are no guarantees in trading.
Therefore, it’s essential always to have a detailed plan.
I always make sure I have a plan and know exactly what I want to see to enter a position.
As I have said before, time and time again, all I can do is to plan the trade and trade the plan.