
Before I get into the good stuff, I want to give a massive shout-out to all of my members in the chatroom and my fantastic moderators!
The bar has been raised this year. The moderators in the chatroom are doing a fantastic job with their call-outs and ideas.
I just love to see it.
Let’s keep up the good work, gang!
Yesterday I bought a stock showing signs of a reversal, and I want to fill you in on a bit of a secret.
Not only am I going to tell you what I bought and my game plan, but more importantly than that, I’m going to share my EXACT thought process.
That includes the indicators I looked at and WHY.
So first things first, let’s go over the stock I traded yesterday.
Adagio Therapeutics (ADGI)
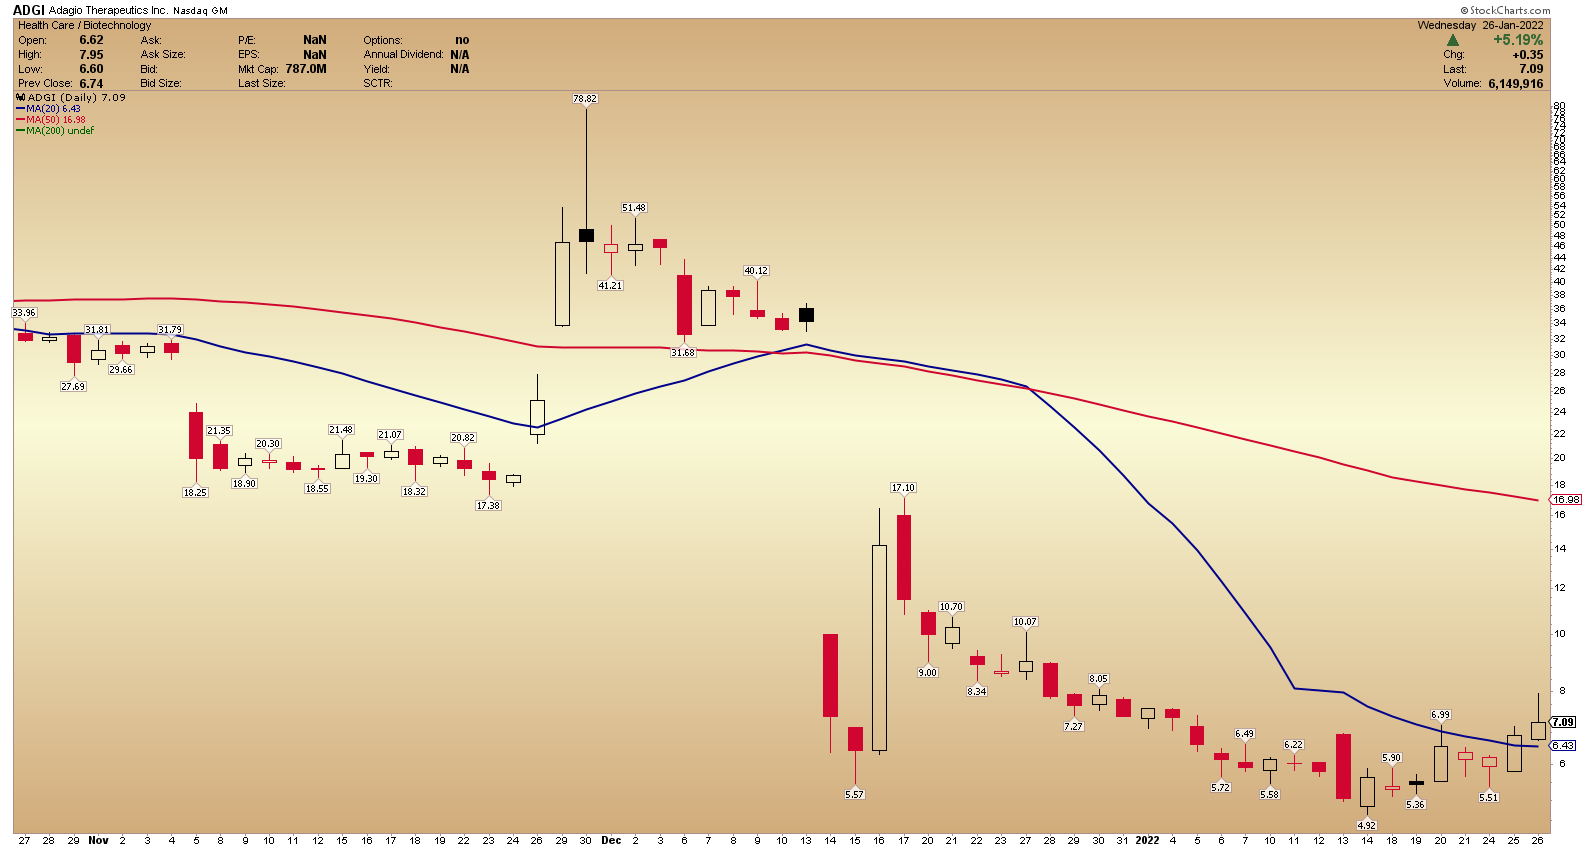
ADGI, according to Yahoo, is a clinical-stage biopharmaceutical company that focuses on the discovery, development, and commercialization of antibody-based solutions for infectious diseases in the United States. Its lead product candidate is the ADG20, a neutralizing antibody in Phase II/III clinical trials for the treatment and prevention of coronavirus disease.
Key Stats, from Finviz:
Market Cap: 807.62M
Float: 51.73M
Short Interest: 13.96%
Average Volume: 8.24M
The stock has an average target price, set by analysts covering the name, of $8.33. That target price is significantly higher than where the stock closed yesterday ($7.09)
My Trade and Thoughts
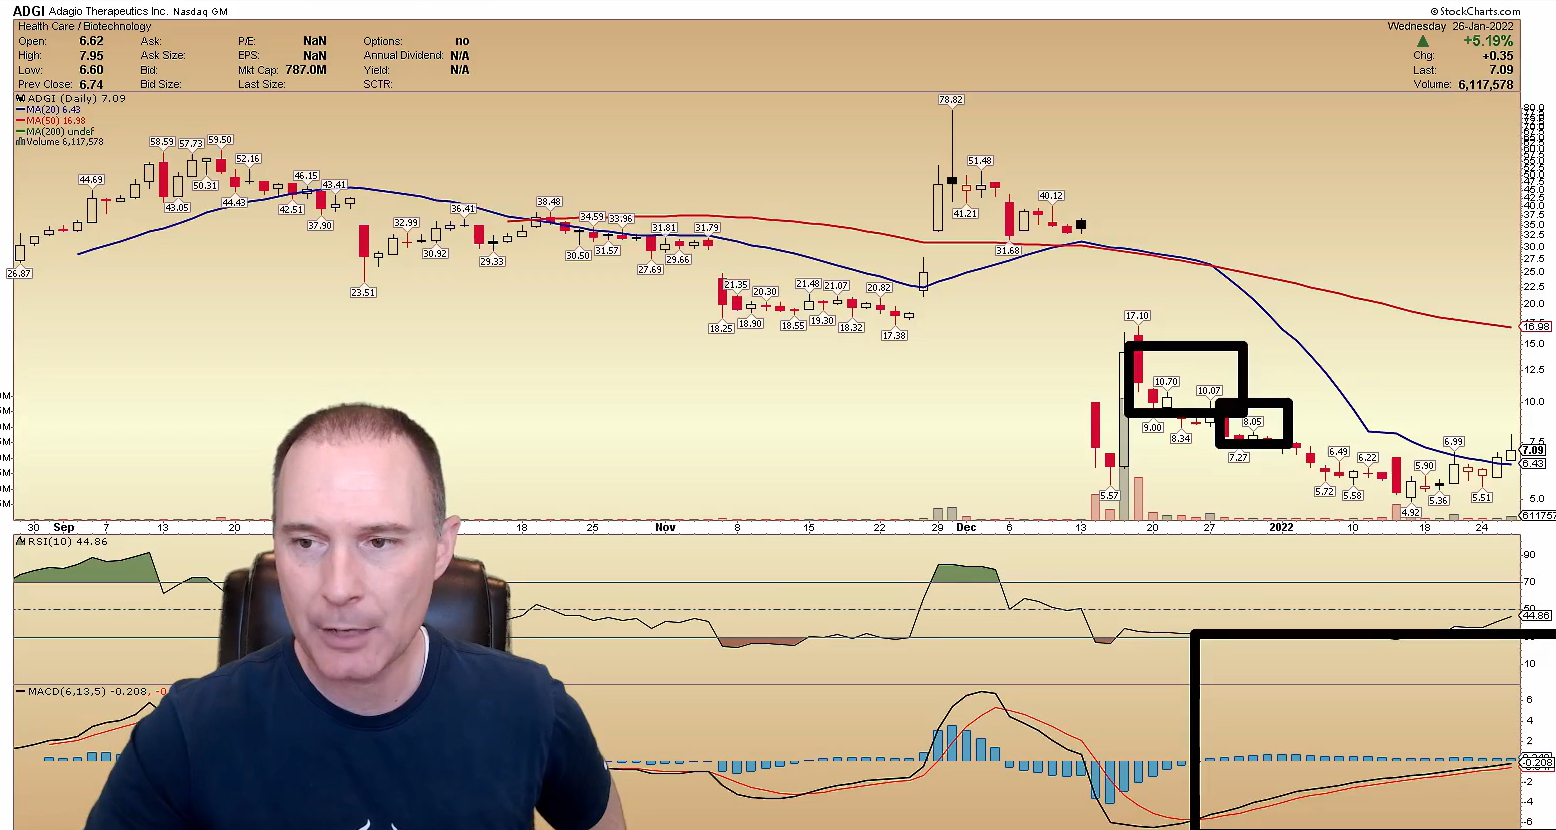
The above is a screenshot from a video I shared with my members yesterday evening.
As you can see, I’ve outlined some key areas and points of interest.
First off, I like the action on the daily chart yesterday because I noticed the stock finally broke above and held above the 20d MA.
That move came after the stock spent considerable time consolidating below the 20d MA.
So that action signaled a change in momentum to me.
Secondly, notice the indicator in the bottom right of my chart, which I highlighted, has begun moving higher.
The MACD indicator, a momentum oscillator mainly used for trend identification and following, began rising even while the stock was still heading lower.
The indicator was moving against the stock’s action, which I find bullish and might signal that this stock could continue its reversal and head higher.
So, gang, as a result of the positive divergence with the indicator, along with the move and hold above the 20d MA, I bought the stock yesterday.
Now that the divergence has lowered and both the stock and the indicator are rising, I continue to like the play and see the potential.
I got long the stock at $7.27, and I am conservatively targeting $8 and more ambitiously targeting $10 if it gets going.
My stop loss is around the 20d MA.