
As you might have heard me say from time to time, I like to be aware of where the overall market is.
Why is that?
Well, gang, because the bigger picture might impact how the penny stocks on my radar act and whether the environment is conducive to momentum or not.
So, before I get into an educational trade recap, I want to look at the bigger picture of the market.
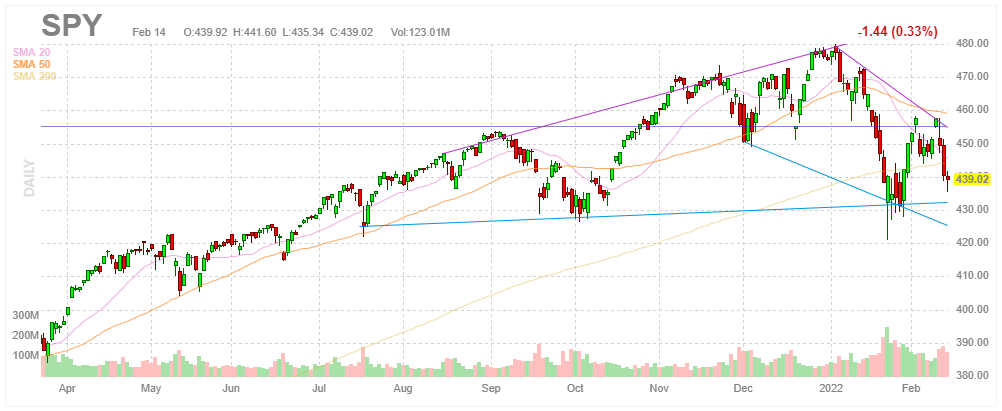
According to Finviz, the SPY is down 5.49% on the month, after closing the day down 0.33% yesterday.
This month’s performance follows the headwinds that have so far plagued the market this month.
Such headwinds have included news surrounding the FED, inflation, and the tensions between Russia and Ukraine.
It’s not all negative, however, gang.
As you can see in the above chart, the SPY has remained above the recent support of $430 and the lows from last month.
This tells me that even with the downtrend in the market so far, the bulls still have reason to be hopeful and somewhat bullish.
At the time of writing this, the market appears to be gapping up.
Therefore, from now on, I will be keeping a close eye on yesterday’s low of $435.34. If the market takes out that low in the future, it might signal further momentum to the downside.
On the flip side, though, If the market can base over yesterday’s high and make its way back to $450 and base above that area, then it might signal a potential short squeeze in the making.
So, while the overall market remains above last month’s lows, I can continue to stick to the patterns and setups that have proved successful for me in the past.
One such setup is the Higher High, Higher Low setup.

Recapping the Higher High Higher Low Setup in UVSS
According to Yahoo, Universal Systems (UVSS) provides turn-key water treatment services to the oil industry.
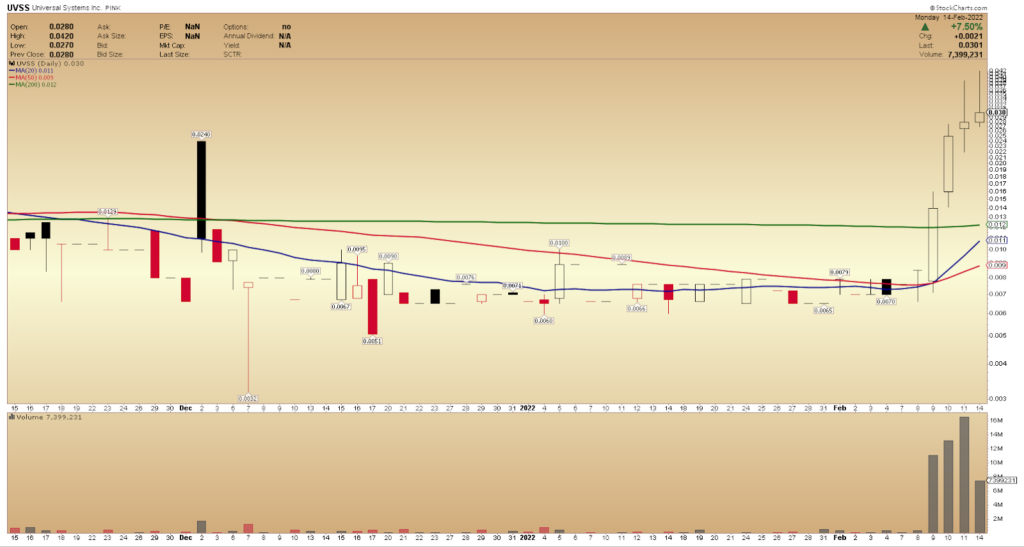
As you can see from the above chart, from stockcharts.com, UVSS broke out of a tight range on February 9, 2022, and experienced an increase in volume.
The following day, the stock continued to move higher after volume increased over the previous day, and the stock made a higher high and higher low.
Not only had the stock maintained the breakout in price and volume, but it had also broken above and held above all key moving averages.
Coming into Friday of last week, the stock traded above the 20d, 50d, and 200d MA.
Not only did I like the breakout on the daily chart, but I also liked the momentum the stock had shown me by holding above these moving averages and making a higher high and low over the previous day.

As a result of the Higher High Higher Low setup (highs and lows circled in green) in UVSS, I got long the stock on Friday at $0.031.
I was looking for the stock to retest the highs from Friday and perhaps continue the higher high higher low pattern.
After the stock traded higher in the morning and approached Friday’s high, I sold my position yesterday at $0.038.
Here is a screenshot from my trade journal, showing my entry and exit:

The Bottom Line:
I doubled down on the basics and respected price action for this particular trade.
I kept it clean and straightforward with this setup by identifying the pattern noticing the increase in volume, support, and resistance.
So, gang, I hope you liked this trade recap as well as my brief overview of the bigger picture.
Stay tuned because I look forward to dropping some more educational pieces and recaps with you in the future!


3 Comments
Thank you, Jeff! You rock!
I want to A daily set up
Danny,
Thanks for the reply! Check this link out to get set up – https://thedailysetup.com/?utm_source=wrbrbtds&utm_medium=w&utm_campaign=tdsproductweb&utm_content=wwazknormfdisdaily-setup-for-your-day&utm_term=de
If you have any questions, please give us a call at 410-775-6138.
Good trading,
RagingBull Support