Not my usual thing, but to keep things interesting for you, I had my eye on an IPO yesterday.
Not just any IPO though, I’m talking about the “Uber of China.”
Didi Glocal Inc. (DIDI) debuted on the NYSE with an IPO that opened up nearly 19% yesterday.
But that’s not the story.
Didi Global Inc. ADR (DIDI) IPO
DIDI began trading on the NYSE yesterday opening at $16.65, almost 19% above the IPO pricing of $14.
And that was it for the initial excitement.
The stock couldn’t hold it’s gains and ended the day at $14.17. The good news, it held above the IPO price.
It’s nothing to write home about. But to me it’s more interesting than that.
After all, it’s the “Uber of China” mind you. And it was priced accordingly, with a nearly $70B market cap.
Is it worth it? Well first off, I’m neither an analyst, nor a financial advisor. I’m a short term trader, so that’s not a question I’m even concerned with.
Just off its face, China is a much bigger market than the US, with increasing urban populations and incomes and lower car ownership than in the US, making it an attractive market for ride-sharing.
DIDI is backed by some significant China muscle, including Softbank, Tencent, and Alibaba. Granted, that’s pretty common when it comes to substantial technology industries in China.
And our own beloved Uber is also connected after selling its China operations to DIDI back in 2016 for an ownership stake that is worth billions.
Now that said… the current market cap is already up there with Uber, so that’s a concern for some. However, it’s a huge market with massive growth potential.
The biggest worries from investors come from the recent pressure China has been putting on internet giants. For example: The exciting Ant Group IPO that was shelved by regulators last year.
And DIDI has already been named in different government inquiries, for which there is no way of knowing what will come.
Those are some things to keep in mind while trading a stock like this…
But as a trader…what really interests me is the chart.
IPO Price Action
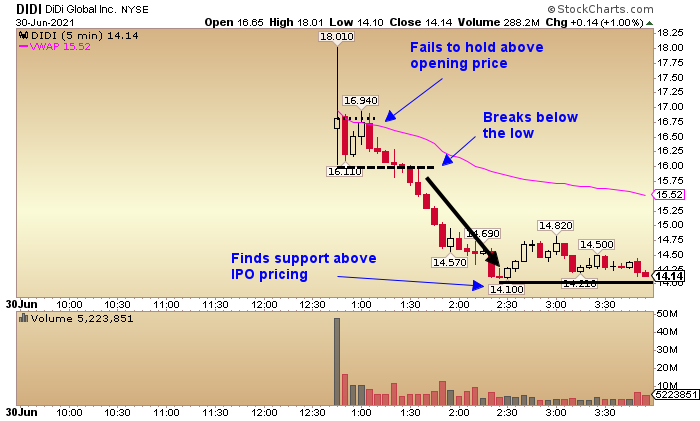
The first 5 minutes of trading were wild, opening up at $16.65, the stock hit a high of $18.01 from a low of $16.03…
Trading was a little more fluid after that with the stock unable to hold above the open price and then proceeding to make a new low on the day.
So what made me so interested in watching this stock?
Price Action.
I was watching the price action to see if DIDI would find support above the IPO pricing of $14 or if it breaks below and wreaks havoc on investors.
When a stock breaks below the IPO pricing, it has a tendency to get dicey from increased selling pressure. So that $14 price is pivotal here.
Take a look at the chart…

In the first hour of trading the stock was finding it’s range. As mentioned it failed to hold above the opening price…showing resistance there.
After which, it broke below the opening range low of $16.03 which led to a slide towards the IPO price of $14.
And this is where DIDI found support, just above the IPO price. The stock hit a low of $14.10 and ended the day at $14.17.
What’s Next?
Now that the IPO trading day is in the books, I have established price levels to keep an eye on.
Will DIDI continue to hold above $14? If so, will it be able to get back above the opening range of $16.10 – $17 and make a move back to highs?
Let’s look at what’s happening now…
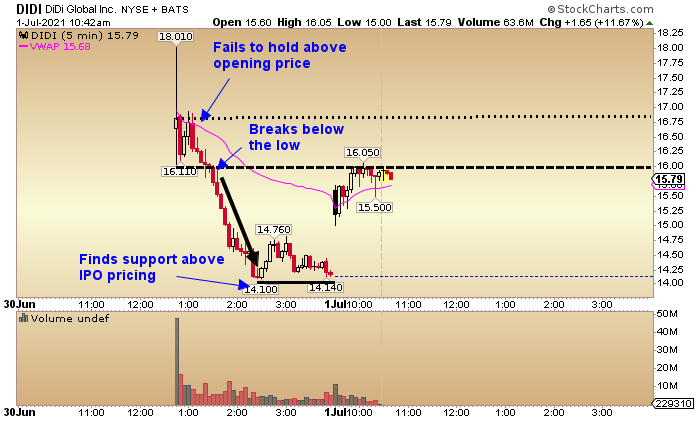
I extended the lines from yesterday. The dashed opening-range low and the dotted opening price.

DIDI gapped up to $15.60 this morning and has been holding nicely so far.
However, it’s currently sitting at a point of resistance as it tests the IPO opening range low at $16.03 (dashed line).
If it can break above here, I’ll be watching for a move to the opening price of $16.65 (dotted line) and a break above there if momentum picks back up.
If it fails here, I’ll be watching for a move back towards $14…and to see if it can hold there a second time.
IPOs can be fascinating to watch…
And with the amount of IPO activity as of late, it could serve you to take some time and study the charts. See how a stock reacts at key levels like the opening price vs. IPO pricing, as well as the range it makes on the first day and first week etc.
Find key levels of support and resistance and just watch how the stock reacts in the coming weeks and months. You might uncover something.
Comments are closed.


6 Comments
This web site truly has all of the information and facts I needed about this
subject annd didn’t kjow who to ask.
Nice lime green tie!!!!😻🍸
Hey there! Do you use Twitter? I’d like to follow you if
that would be okay. I’m undoubtedly enjoying your blog and look forward to new updates.
I like it whenever people get together and share opinions.
Great blog, continue the good work!
I’m interest
It’s amazing in support of me to have a site,
which is beneficial in support of my know-how. thanks admin