Dear Insider–Jeff Bishop here,
The market’s been through a lot lately…
Just when it seemed to have shrugged off the economic uncertainty and the general overheating, the Ukraine crisis knocked right on the market’s door.
That sure took its toll – so far, major indices have failed at any meaningful bounce.
Here are the Qs, as one example:

What is interesting, though, is that Jason Bond was able to foresee both the geopolitical woes and the economic instability using just one simple trading pattern – something I told you about last week.
Let me recap what exactly Jason’s idea was and try to 8-ball what happens next.
Market’s Head and Shoulders
Just last week, I told you that in Jason’s view, the market is doing something strikingly similar to a very old trading setup, called the Head and Shoulders.
Here’s how it looks “on paper”:
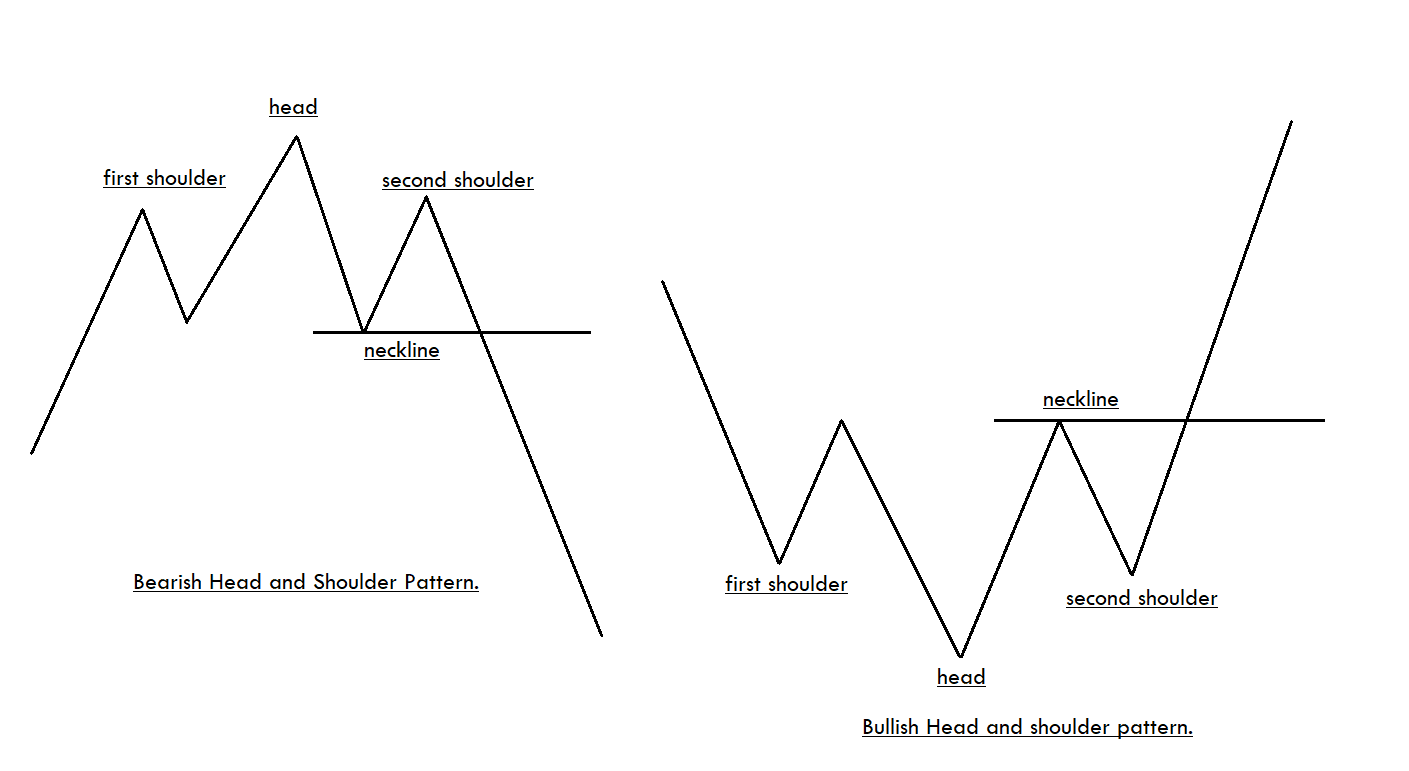
And here’s a quick recap of how it works and why:
- Bullish Head & Shoulders: a stock is trending up (First Shoulder), breaks to a new high & gets longs to buy the breakout (Head). It then pulls back and has another retest of the recent high (Second Shoulder), involving even more longs. The retest fails, now all the longs are uncomfortable and begin selling, pushing below support (Neckline) and then some more!
- Bearish Head & Shoulders: a stock is trending down (First Shoulder), breaks down to new low & gets shorts selling the breakdown (Head). It then bounces, and has another retest of the recent low(Second Shoulder), involving even more shorts. The retest fails, now all the shorts are uncomfortable and begin covering, pushing above resistance (Neckline) and then some more!
Last week, Jason Bond noted that the Qs are painting something nearly identical to Bearish Head & Shoulders.
Here’s his direct quote: “However, if $370 acts as resistance, I’ll be watching for a bearish head and shoulders pattern and looking to get short.”
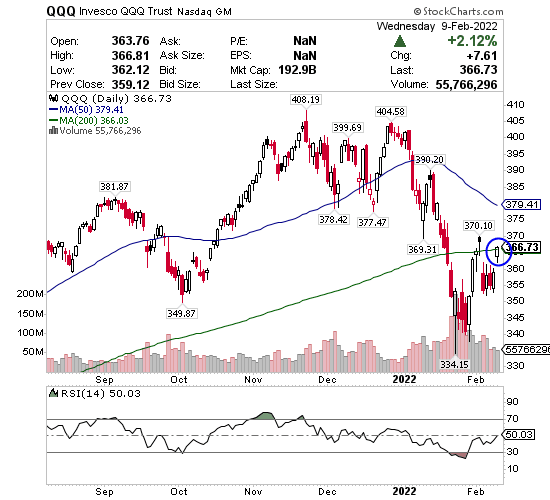
Well, over a week has passed and today’s chart of QQQ has surely proved Jason right:
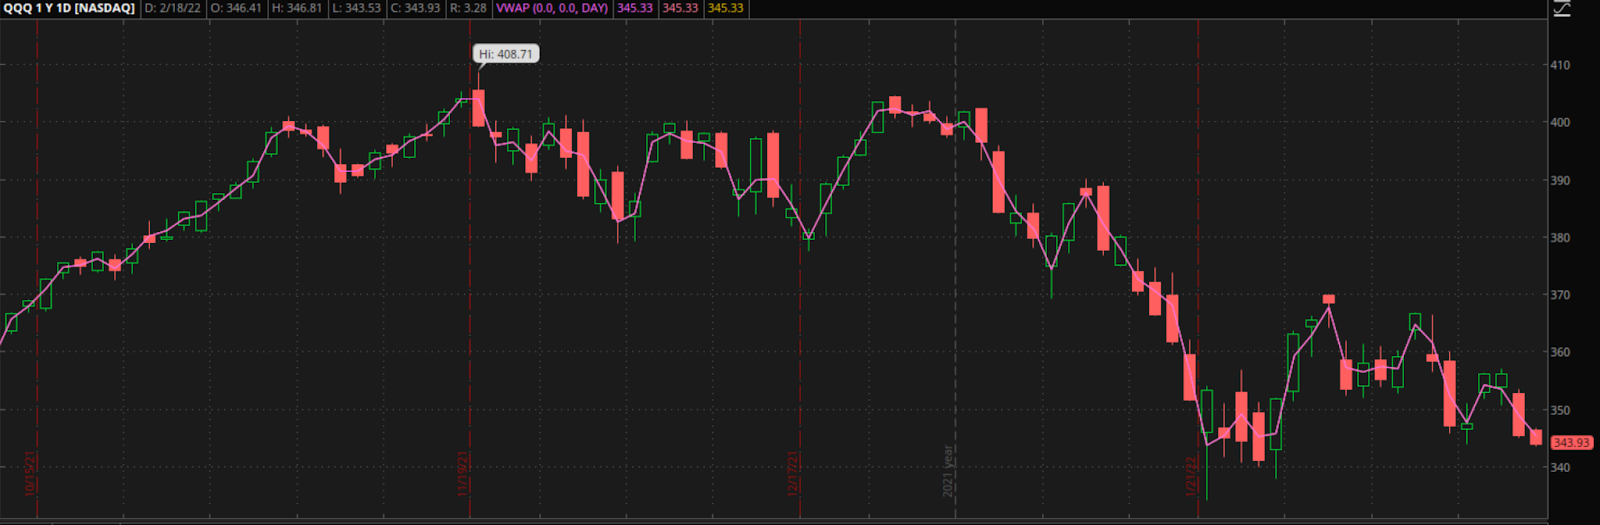
The Qs never touched the $370 again and continued lower, selling every pop along the way.
So here comes the elephant in the room – as you can see from the “paper” head and shoulders example above, a bearish version usually results in a massive breakdown. The key question then becomes – is the market about to flush much lower?
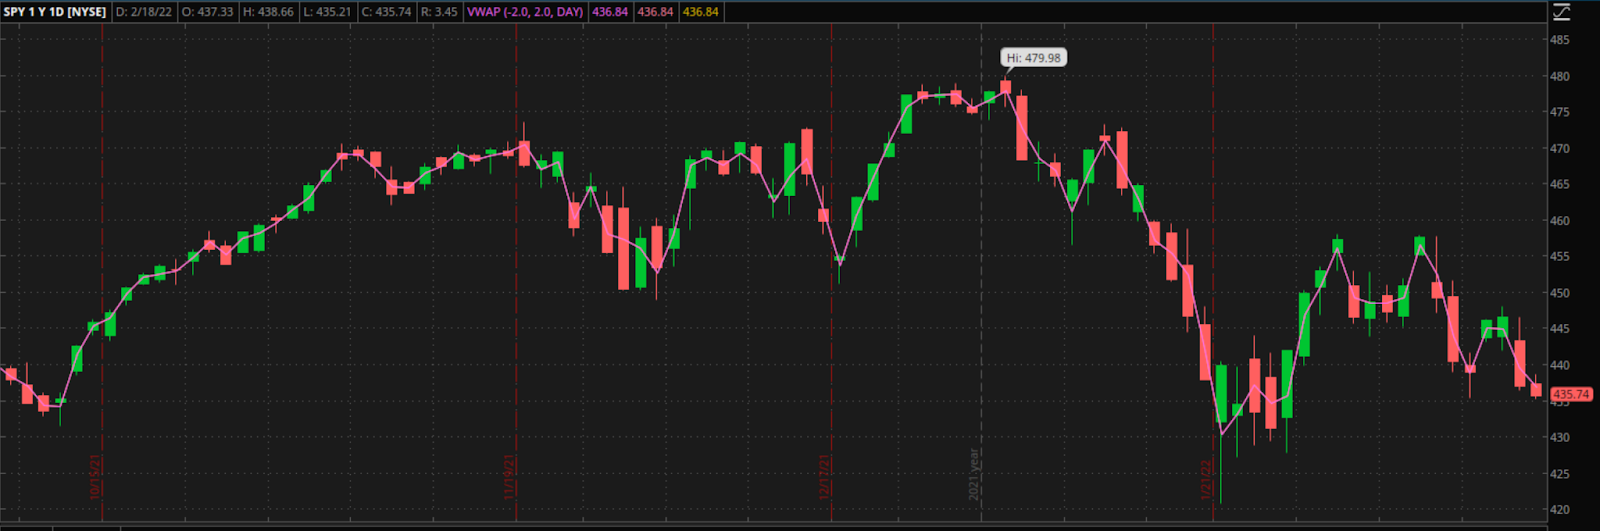
The charts surely paint a bleak picture with the SPY not looking any better:
But I wouldn’t bet the farm on the breakdown just yet.
As the news tone shifts to a more positive one, it is very possible the SPY may find support in the $435 area, and the Qs in $343 – and we finally see a bounce.
Nonetheless, this is a major psychological level. If the market fails to hold up, next week may prove ugly – the culmination of the bearish Head and Shoulders.
I wouldn’t be surprised to see the SPY flush into the $410 area.
With so much uncertainty, I’m staying nimble for now – I’m planning to “react-trade” to any major flushed or bounces intraday.
Be sure to pay me a visit in the Master’s Club, where you can see my trades in real-time.