I don’t know how much attention you’ve been paying to the broader market – and if you haven’t, I’d recommend you take a peek every once in a while – but we’re in a really peculiar spot at the moment.
See, we’ve had that scary crash:
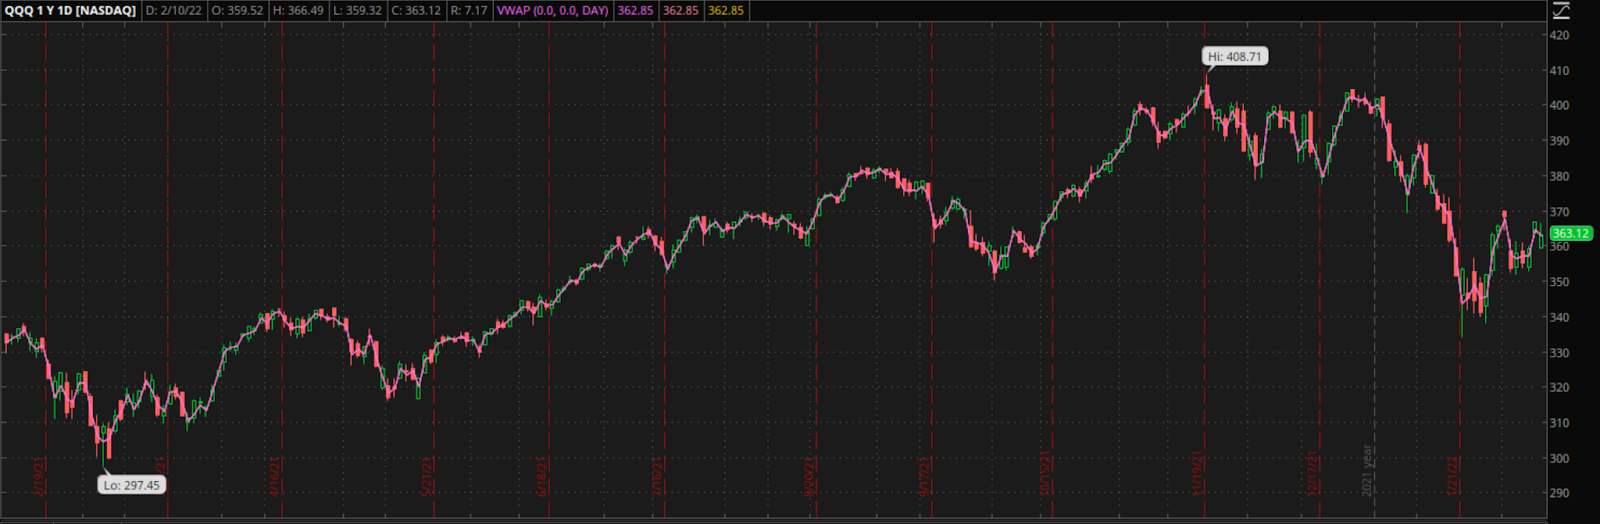
… pulled back and retraced some of the losses… and now, we’re just sort of up in the air!
The Qs are sitting right near the high of the pullback at a “decision point” of sorts, with 2 options:
- A Breakout higher and a full-on bounce
- A Fail and a slide lower, possibly back to recent lows.
And our very own Jason Bond may have an answer for you…

Even more, interestingly it comes from a very classic reputable trading pattern!
The Head and Shoulders Setup
Any talk about classic trading patterns – those that have repeated over literally decades – can’t be complete without the “Head and Shoulders”.
The pattern is quite simple and chances are solid you’ve seen it before.
On paper (and on chart) it looks something like this:
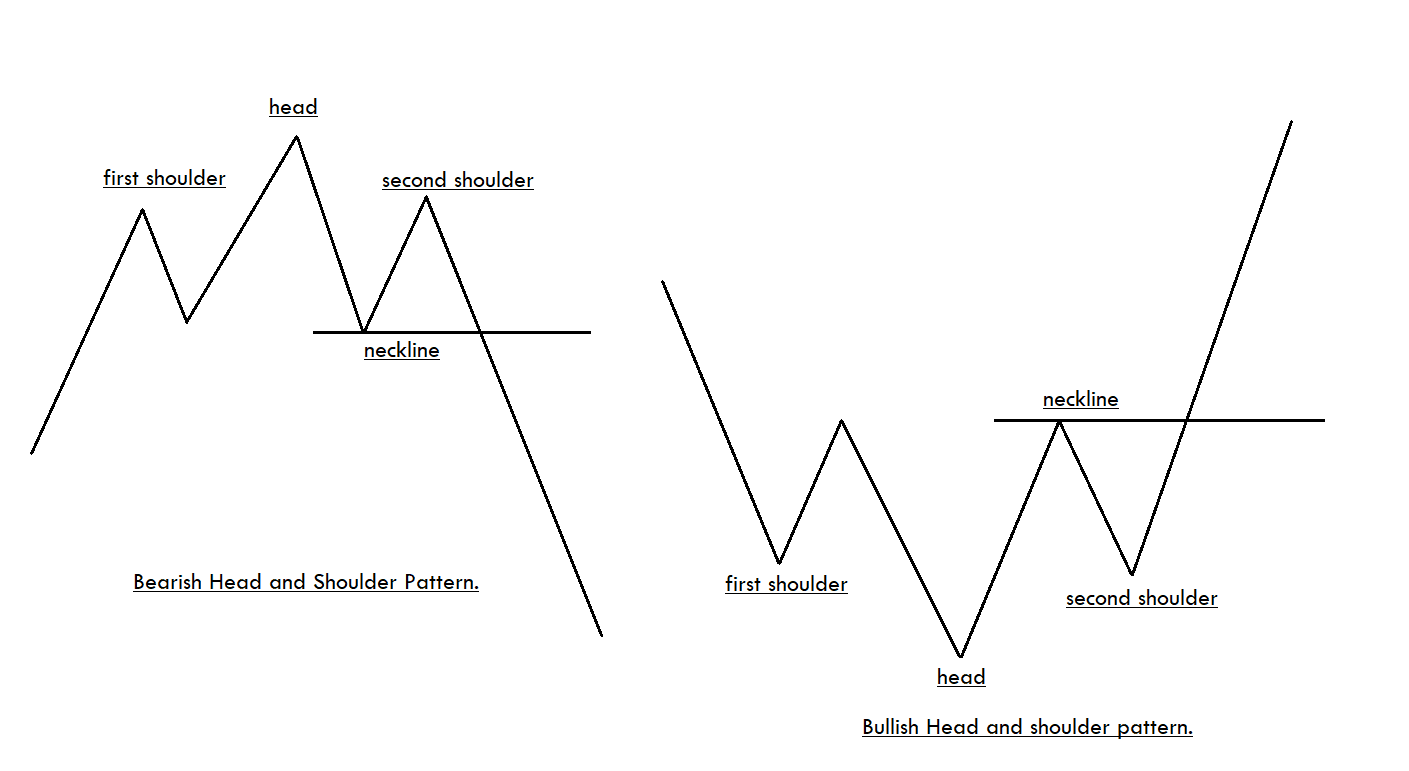
As with most patterns, traders usually distinguish between a bullish and a bearish one.
The ideas are quite simple:
- Bullish: a stock is trending up (First Shoulder), breaks to a new high & gets longs to buy the breakout (Head). It then pulls back, and has another retest of the recent high (Second Shoulder), involving even more longs. The retest fails, now all the longs are uncomfortable and begin selling, pushing below support (Neckline) and then some more!
- Bearish: a stock is trending down (First Shoulder), breaks down to new low & gets shorts selling the breakdown (Head). It then bounces, and has another retest of the recent low(Second Shoulder), involving even more shorts. The retest fails, now all the shorts are uncomfortable and begin covering, pushing above resistance (Neckline) and then some more!
So you see, how this works, right?
On either end, it involves people positioned for a breakout, and once that fails – they have to sell/cover, bringing about a move in the other direction.
And this is exactly Jason’s point!
Jason’s Market Idea
Here’s a quote from Jason watchlist this morning:
“QQQ made it back to the 200-day SMA. I’ll be aggressive with my trades if it hangs around there. However, if $370 acts as resistance, I’ll be watching for a bearish head and shoulders pattern and looking to get short.“
And here’s his chart:
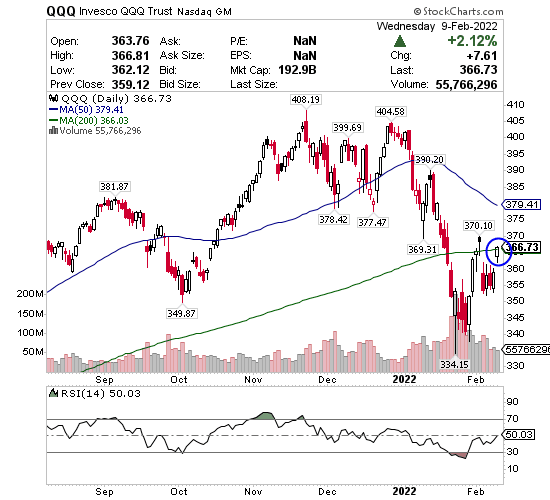
Are you noting any similarities with the “paper” example from above?
Many people are positioning for a bounce higher right now.
What happens if we have a fail here and the longs are forced to sell out?
Jason’s thesis surely makes sense, but don’t jump on it just yet (or at all)!
Note that Jason first wants to see a retest of $370 and a FAIL! It is only after he gets the Confirmation, that he can start planning for an actual trade!
Always wait for confirmation of your ideas, and make sure your risk/reward is worth it!
Oh, and come see us in the Master’s Club!