Bollinger Bands: How to Start Trading Stocks Using Technical Analysis
What are Bollinger Bands and how can you use them? If you want to start trading stocks, there’s a lot to learn. One key tool when you start trading stocks is technical analysis.
Technical analysis uses chart patterns to signal when to buy, sell, or to short a stock. There are a lot of different indicators available, but one of the most widely-used tools is Bollinger Bands.
It’s simple to use, and nearly all charting software offer this indicator. Let’s look at how to use Bollinger Bands to signal when to buy, sell or short a stock.

Bollinger Bands: How to Start Trading Stocks Using Technical Analysis
The Origin of Bollinger Bands
Bollinger Bands are actually a technical analysis tool that was invented by John Bollinger, after whom it is named, in 1983.
Bollinger Bands, at the very basic, help detect spikes in price movements over the short term. The tool is invaluable to traders it helps to determine the volatility of stock and price dynamics.
What Are Bollinger Bands?
Bollinger bands take the form of an envelope or of “bands” that are placed both on the upper and the lower sides of a moving average line. Volatility is directly linked to the standard deviation which statistically measures the variation around an average value. The shape of Bollinger Bands is a function of the volatility, which means that as volatility rises, the bands take a wider form and when they decrease, the bands contract in size.
Actually, Bollinger Bands consist of three bands. The middle band is the moving average, and the upper and lower band are deviations from the moving average. The upper band is set by a certain number of standard deviations of the price., and the same goes for the lower band. Therefore, this indicator takes into account volatility.
The whole idea behind the indicator is that if a stock’s price is above the upper or lower band, it indicates the stock price might “too high” or “too low” and provide indicators to alert a trader whether it is time to buy, sell, or short a trade.
How to use Bollinger Bands to Gauge Volatility Trends
It is no hidden fact that volatility keeps changing. In general, the market shifts from high volatility periods to low volatility periods and the reverse trend is also possible. However, new traders can find it extremely difficult to gauge volatility trends in the market.
This is when Bollinger Bands come to your rescue because he width of the bands could be used as an indicator of volatility. We just discussed how the bands vary with volatility which means this could be used for an analysis of the volatility metric. If the bands are narrow, it indicates there’s less volatility. On the other hand, when the bands are wide, it means the stock experiences higher volatility.
Configuring Bollinger Bands
Generally, traders like to use the 20-period moving average for the middle band. Thereafter, they may set the standard deviations to 2. Thus, the upper band would be 2 standard deviations above the 20-period moving average. Additionally, the lower band would be 2 standard deviations below the moving average.
Now, let’s look at some trading strategies depending on Bollinger Bands following which we shall see some examples to give you a better idea of how to start trading stocks using technical analysis.
Using Bollinger Bands For Developing Trading Strategies
Bollinger Bands can serve as indicators of trends which can help you decide how to trade stocks at a particular point in time.
You will see the volatility grows as an indicator of strong trends. The bands will move away to start with.
Using Squeezes
There’s an interesting term called “squeeze” which is used to refer to the condition of low volatility. It is marked by narrow bands – in fact, you can quickly identify a squeeze by examining Bollinger Bands for the 6 month period. The area where the bands “squeeze” to the narrowest is where the squeeze is located.
Interpreting Bollinger Bands Correctly
Stocks are considered to be pricier when the price is close to the upper band. Conversely, when the price is closer to the lower Bollinger Band, stocks are cheaper. That said, this does not imply you can straightaway start trading at these points.
You see, it is also important to interpret Bollinger Bands in the right way. For instance, beginners often commit the blunder of buying when the stock price meets the lower band. Similar is the case when they decide to sell on seeing the price hit the upper band.
However, experts warn against making buying or selling decisions merely on the sign of the price hitting the lower or upper bands, and this is definitely not the best strategy for you to use.
The Double Bottom Strategy
An interesting pattern to look out for is the first time in the observation period when the price hits the lower band. At this stage, you should wait and watch where it is that the next price dip occurs in relation to the Bollinger Band.
The double bottom strategy suggests that traders can be very successful in their endeavors if they buy at the time of the second price low.
Consider when the first price low either hits the lower band or is outside it and the price then increases up to nearly the middle band, reacting, following which the second price low appears within the lower band confines. This is suggested as a great time to buy as it could strongly indicate an upcoming price rise.
You should also consider going through our resource on Bollinger Bands which presents the best practices you should keep in mind when using this tool in your trading.
Bollinger Bands Examples
Check out the daily chart on Michael Kors Holdings Ltd. (KORS).
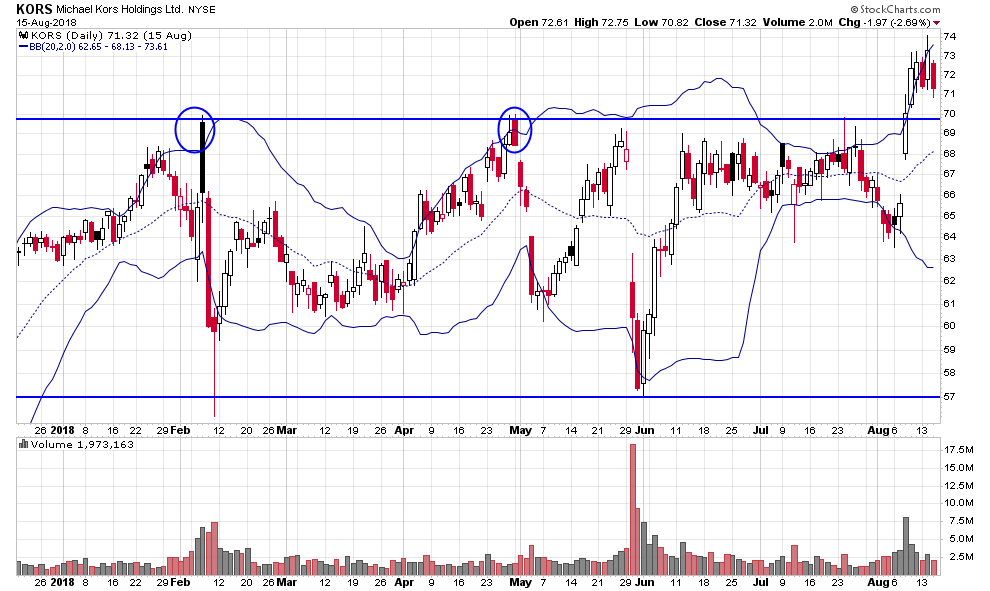
Now, we set the Bollinger Bands to 20 and 2. That means we used a 20-day simple moving average (SMA) and 2 standard deviations.
If you look at the chart above, you’ll see some horizontal lines. These could be used in conjunction with Bollinger Bands. Notice how KORS formed a top around $70, and the first time it broke above the upper band, it reversed the next day and found support around $67. After it broke the lower band, the stock rallied and approached resistance again and was above the upper band.
This would be a short signal. You could have shorted the stock around $69 and placed a stop above $70, which was the previous high. This pattern is known as a double top and is considered a bearish pattern. If you shorted the stock at those levels, you could have had some nice gains. Moreover, you could have covered your shares once the stock’s price broke below the lower band.
When a stock’s price breaks above the upper band, it signals a reversal is in the cards and the stock could fall. Conversely, if the price breaks below the lower band, it signals the stock could reverse and run higher.
Here’s a look at KORS again, but this time we’ll focus on looking at when to buy the stock.
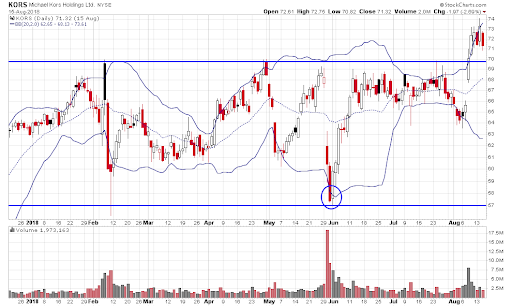
You could also use bands to signal when to buy a stock. If you look at the chart above, you’ll notice KORS had some support just below $57. You could have used that level as a stop. Notice the encircled area.
KORS broke below the lower band and you could have bought shares around $57.10 and stopped out if it broke below $56.50. The stock reversed after breaking the lower Bollinger Band and hit a $69 a few days after.
When you’re using Bollinger Bands, you should consider combining the tool with other indicators. For example, you might look at earnings, short interest, momentum and chart patterns.
Final Words
You could start trading stocks using technical analysis once you have got a good grasp of some indicators and Bollinger Bands could be a powerful tool in this regard.
However, you should use this indicator with other tools, such as support and resistance, trend lines or other technical patterns. Moreover, you might want to use technical analysis with catalyst events, which should increase the probability of success.
Keep in mind that technical analysis is an art, and the stock could still continue higher or lower, even if it breaks above or below the upper or lower band, respectively.
Ultimately, it’s all about developing a deeper understanding of how the market works and honing your skills with these tools to use them the right way. We highly recommend checking out this amazing resource on Bollinger Bands which has excellent tips and guidance from Raging Bull’s traders. You’ll find that it packs in time-tested strategies for you to benefit from when trading in the markets.