
The RSI divergence indicator helps stock traders spot and take advantage of investment divergence. When used correctly, RSI can be one of the most effective trade and confirmation indicators in your arsenal. RSI is one of the most popular tools in swing trading, a technique in which traders ride out the markets in order to make the best possible moves.
What Is RSI Divergence?
With RSI divergence, the relative strength index of a specific stock shows lower highs when the price uptrend hits higher highs. Conversely, when the price is trending downward, it will hit lower lows with divergence while the RSI hits higher lows. While both indicators are either traveling upward or downward simultaneously, the RSI is beginning to diverge from the stock price.
Divergence indicates that the current price trend is flagging, which provides insight into whether it’s time to make a move to buy or sell that particular stock. When an indicator disagrees with the price, this lack of synchronicity indicates a likely change with the chart.
A hidden bullish divergence indicates the continuation of an upswing. You’ll notice on the trend lines that the RSI indicator makes a lower low than the price, which hits a higher low. Conversely, a hidden bearish divergence happens when a stock is trending downward. This trend will likely continue when you notice that the RSI hits a higher high than the lower high of the price. Either of these provides the information you need to make a smart stock move.
The Role of Relative Strength Index
To truly understand RSI divergence, we must first define RSI. This acronym, which stands for relative strength index, helps measure the direction and momentum of a specific stock. Generally, RSI looks at gains and losses over a 14-day period, although some traders rely on shorter and longer time intervals in various circumstances. An RSI indicator increases when a stock increases in value and decreases when the opposite is true. RSI is measured on a scale of 0 to 100. When it drops below 30, the stock is oversold and has likely been trending downward for some time. Conversely, RSI of 70 or above indicates a stock on an uptrend that is now overbought.
To calculate RSI, divide the average gain in the stock’s up periods by the average loss in the stock’s down periods. Add one, then divide the result into 100. Subtract the resulting number from 100 to find your RSI. For example, if the average gain over 14 days is 50 and the average loss is 20, your equation would look like this:
100-100/(1+50/20) = 100 – 100/1 + 2.5 = 100 – 28.57 = RSI of 71.43.
Traditionally, proponents of this indicator advocate selling stock when RSI exceeds 70 and buying when RSI drops below 30. However, these numbers are just guidelines and should not be used when you plan to go short or long with a stock. Instead, use RSI as a secondary indicator to support a separate primary buy or sell indicator.
Drawing a Trend Line for RSI Divergence
RSI trend lines are slightly different than traditional trend lines. When looking for divergence, draw a line from the highest high or lowest low to the previous highest high or lowest low. Ignore smaller dips and changes that take place between those peaks and valleys. Compare these lines with the price action trend lines for that stock. Make sure you are comparing highs to highs and lows to lows, not highs to lows or vice versa. If the slope of the indicator line is different from the slope of the price line, you’ve found a divergence!
Using RSI Price Divergence
RSI divergence is primarily used to determine when it’s time to sell because prices are likely to drop or when a general trend reversal is in the cards. As a leading indicator of a trend reversal, divergence should be combined with other technical analysis methods when making the decision to act on a specific investment. For best results, rely on RSI when you are dealing in a market that is choppy or range-bound. In this case, divergence can help you locate the top and bottom of the market. As with other types of indicators, you can adjust RSI divergence based on your trading preferences and strategies.
Keep in mind that while divergence typically represents a shift in price action, it does not necessarily mean a strong reversal will follow. Often, this type of asynchronicity simply indicates a momentum loss. Try filtering by location so you are looking at potential divergence and trend changes only once the price moves into a designated resistance or support zone.
Understanding Stock Momentum
You already know that RSI is a key indicator of an investment’s momentum. But how does momentum affect your trading action? Short-term price swings, which are easily detected by looking for RSI divergence, show up on your chart as steep slopes with a long price swing when momentum is strong and a short price swing and shallow slope when momentum of a particular stock is weak. As an upswing grows longer, momentum grows stronger. When price is choppy on a specific chart, use RSI divergence to smooth the trend line and obtain a clear picture of swings in price. Momentum is calculated with the formula M = CP – CPx, where CP is the current closing price and CPx is the closing price from the beginning of the period you are analyzing.
Pairing Divergence With Other Signals
RSI divergence works well with a host of other technical analysis strategies. Try some of these ideas to integrate this powerful indicator within your existing trading routine:
- The Bollinger band strategy will give you information about prices above and below market value when used along with RSI divergence analysis. Bollinger bands are one of the most widely used stock tools and provide data that lets you know when to buy, sell, or trade a stock. With this tool, locate a moving average line and place bands on either side determined by the amount of standard deviation. This allows you to gauge stock volatility and plan your next steps.
- RSI in combination with a candlestick strategy can provide insight about resistance and support zones as well as price structure. Primarily used in day trading, candlestick charts indicate whether a specific stock is bearish or bullish over your designated time frame. With this strategy, traders can plan exact entry and exit from the market to optimize profit.
- Try a moving average cross strategy, which provides crossover, support, and resistance signals, along with RSI divergence to confirm trends. With this strategy, a change in trend is indicated when the trend line for the moving average crosses over a designated point.
- Moving average convergence/divergence(MACD) can optimize profits when paired with RSI to look for histogram crossovers and daily support and resistance levels. Like RSI, this strategy also looks at trends and momentum in an attempt to predict the next movement of a stock.
Remember that if you find a divergence and the price has already reversed, you’re too late to act on this particular intelligence. The longer your time frame, the more accurate your signals and the less likely you will be to lose out by acting on a false signal. For RSI, the ideal chart time is one hour, though some seasoned traders even use 15-minute charts to take advantage of this strategy.
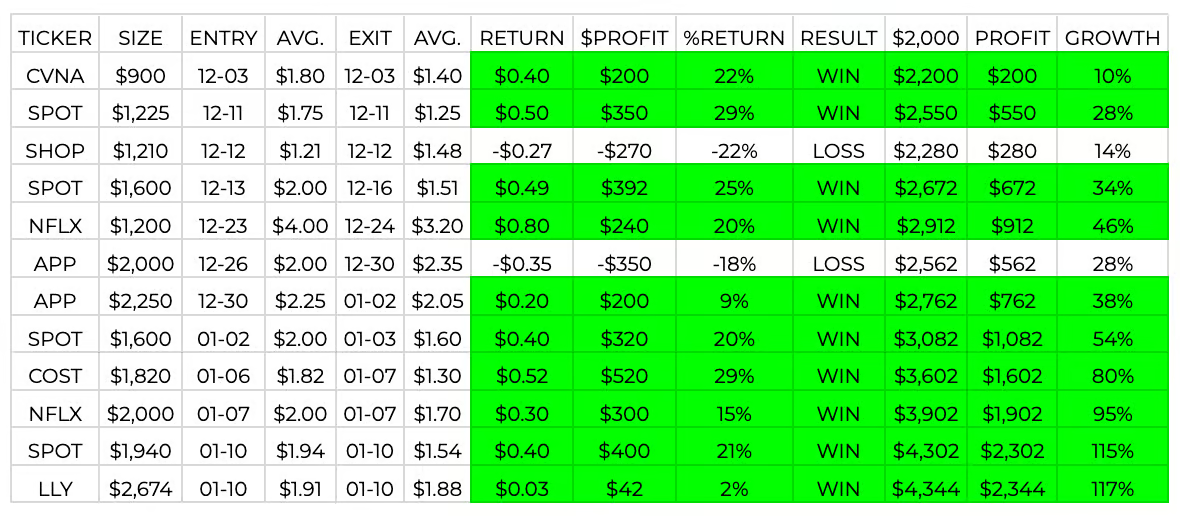
Experts recommend looking for a profit of 15 to 20% when swing trading. With the signals of a trend reversal, you can time your buy and sell action with greater accuracy, significantly improving your bottom line thanks to the info you gather from divergence.


2 Comments
Awesome article! Thanks for sharing the great information! I’m a tad visual and wondered if you had any chart examples of a bearish and bullish divergence?
How accurate is utilizing RSI divergence accurately for buy in time? Percentage wise..