The market sold off heavily to finish the week, after some hawkish comments from Fed chair Jerome Powell. The Professor warned subscribers that he was Bearish on the market on Wednesday Live in Master’s Club, so this should not have caught anyone off guard!
The Professor is also turning more and more bearish and has 2 new Bearish Stock Picks that look set to break down!
Inflation looks set to possibly put us into a recession, and that’s not good for stocks. Unless the Fed changes its tune, it looks like rough sailing ahead. I think that betting against stocks is the thing to do right now, and I might do a webinar about that this week.
Here are some comments from Master of the Universe, Fed Chair Jerome Powell from this week:
With inflation running roughly three times the Fed’s 2% target, “it is appropriate to be moving a little more quickly,” Powell said in a discussion of the global economy at the meetings of the International Monetary Fund. “Fifty basis points will be on the table for the May meeting.”
This could be the beginning of multiple rate rises to come to combat inflation. This might only make things worse for consumers, as people’s budgets are already being hit due to higher gas, food, and heating bills. We learned that with NFLX earnings this week, as the company lost subscribers who are no longer willing to pay to stream movies every month, for some, keeping the lights on at home is more important.
This is not an environment to be bullish for the most part, and the Professor has 2 new stocks that look set to break down!
Here are his Bearish Picks sent out to subscribers on Friday!:

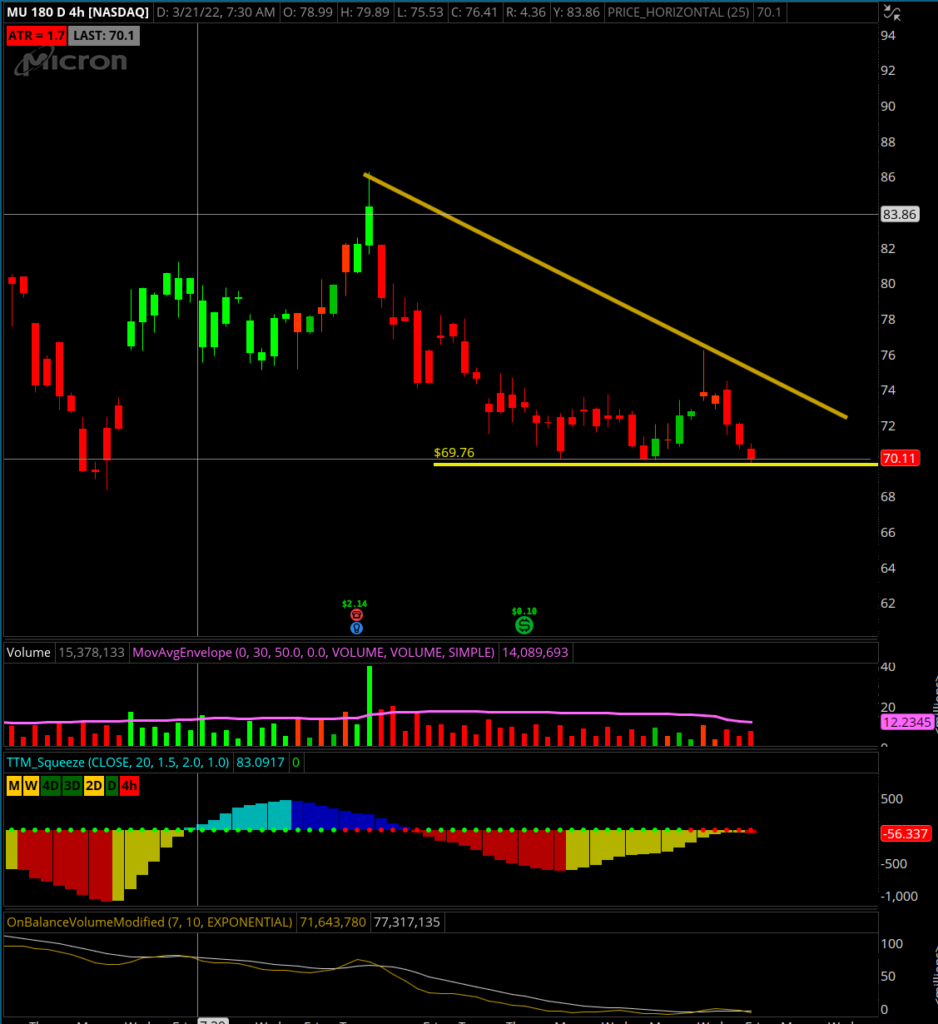
MU 4 hour chart

Trade Setup:
- Descending Triangle: The Descending Triangle is getting close to breaking to the downside as the bears are pressing against the lower support level at this time.
- TTM Squeeze: The TTM Squeeze is showing red dots with negative momentum. As bearish volume continues to come in, I want to see the histogram roll over to more negative values
- On Balance Volume: The OBV is bearish at this time and trending lower, suggesting that there are no buyers at this level.
Trade Details:
- Target 1 : $67.74
- Target 2 : $65.38
- Target 3 : $62.77
- 20 May 70 Puts
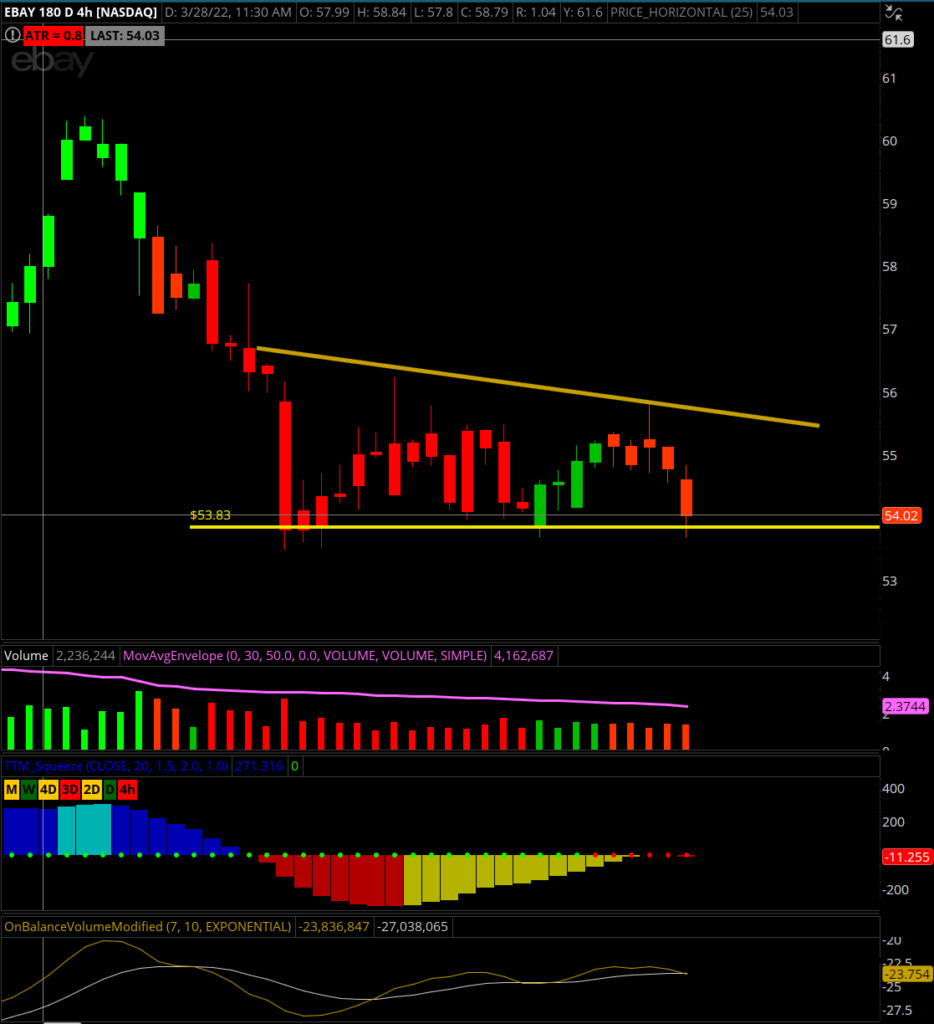
EBAY 4 Hour Chart

Trade Setup:
- Descending Triangle: The descending triangle is getting tested by the bears and there are some buyers still out there with the price getting rejected when it traded under support. I want to see the bears push below and close under this price level to show the new trend is in place.
- TTM Squeeze: The TTM Squeeze is showing red dots and a neutral momentum histogram at this time. I want to watch for green dots to appear with lower momentum on the histogram.
- On Balance Volume: OBV Crossing here suggests a bearish signal and the start of a new downward trend. This could indicate that bulls are no longer buying and it is in the bears control now.
Trade Details:
- Target 1 : $53.01
- Target 2 : $52.11
- Target 3 : $51.1
- 20 MAY 54 Puts


