
“Markets can remain irrational longer than we can remain solvent” is a famous Wall Street adage that has gotten its fair share of playing time as US equity indices have printed new all-time highs with ease during the post-Covid era.
Even in times like this, though the massive fiscal and monetary stimulus is sloshing through the system to protect against adverse market events, it’s crucial to understand when risk-taking has become excessive.
There are numerous indicators to help measure when investors have become too complacent, and many of these indicators were waving yellow flags ahead of this week’s 2nd half weakness.
Complacency is dangerous in the world of trading, as it leads to excessive risk-taking, making traders’ portfolios vulnerable to potentially devastating drawdowns during unexpected corrections.
There are steps traders can take to protect themselves in frothy environments.
One critical lesson that traders learn over time is that excessively bullish sentiment indicator levels often do not act as precision market timing tools.
Instead, as the adage mentioned earlier suggests, extreme sentiment in either direction can persist before exhaustion leads to a reversal in price.
So, what is a responsible trader to do when sentiment becomes too bullish for comfort?
He or she can start by tightening stops on profitable long positions, risking less capital, employing protective options strategies, and becoming more diversified in their holdings.
While the last item on this list – diversification – is a critical aspect of portfolio management that should be practiced at every stage of a market cycle, it gains in importance when the potential for a market correction is highest.
Reducing your portfolio’s beta is a great way to diversify
When a trader works to diversify his or her portfolio, essentially the goal is to reduce portfolio volatility.
This is where a portfolio’s beta comes into play.
When we measure beta, we’re measuring a stock’s sensitivity to changes in the overall market. When we’re talking about the overall market, we’re referring to a benchmark index such as the S&P 500.
Here’s a few examples:
- If a stock has a beta of 1.0 it has the exact same volatility as the benchmark, which is to say it moves exactly like the benchmark.
- If a stock has a higher beta than 1.0 it trades with more volatility than the benchmark.
- If a stock has a beta less than 1.0 it trades with more stability than the benchmark (i.e., it is less volatile).
Therefore, if a stock has a beta of 1.5 it is 50% more volatile than the benchmark. In other words, if the S&P 500 happened to fall 10% the stock would fall 15%.
Finding a stock’s beta is easy
Many charting services these days allow traders to place Beta as an indicator on their price charts. In addition, many online brokers and data services provide beta as part of their stock statistics offering.
Below is just one example of a very popular and free method for finding a stock’s beta.
This first image shows that when you simply search “AAPL beta” using Google, the first item on the results page is a Yahoo Finance summary that includes the stock’s beta.
Figure 1
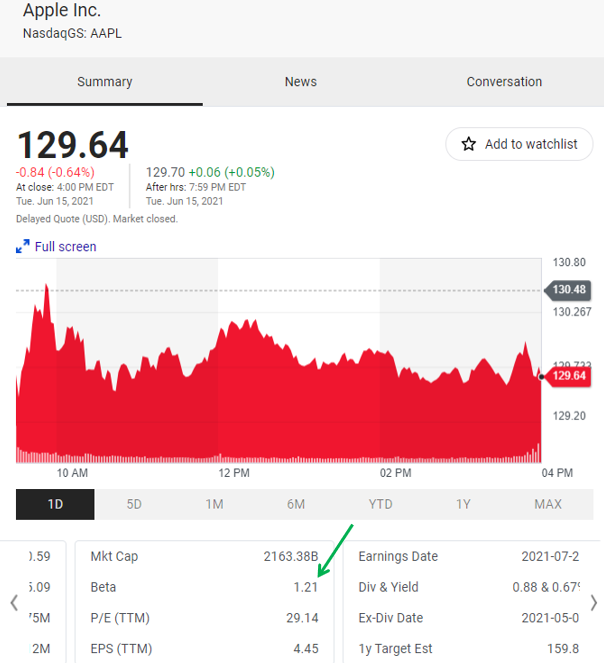
One thing that is important to understand is that there is not a consistent method for calculating beta, so the number may differ a bit between providers.
Beta is commonly calculated by comparing a stock’s monthly closing prices to those of the S&P 500. In the Yahoo Finance version shown above, beta was calculated by using 36 months of closing price data.
This might compare to your online broker that may use 24 or 48 months of data.
In the end, though, the beta figures shouldn’t vary too wildly.
Take the time to determine your portfolio’s beta
Since beta figures are readily available, it is easy to determine the beta of your portfolio.
The process of determining your portfolio’s beta is as follows:
- First, determine the value of each stock you own in your portfolio. This is done by multiplying the number of shares you own by the share price of the stock.
- Next, determine the percentage each stock represents of your entire account.
- Now, take each stock’s percentage weighting and multiply it by the stock’s beta, which has been provided to you by either our online broker account or charting services. For example, if Google makes up 25% of your portfolio and has a beta of 1.36, it has a weighted beta of 0.34.
- Finally, add all of the weighted beta figures.
The end result will look like this:
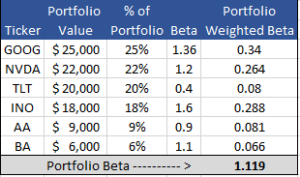
Based on this example, we can see that the sample portfolio has a beta of 1.119, making it more volatile than the broader market.
It’s easy to scan for beta nowadays
Luckily, the competition between online screening/scanning services has become so hot in recent years that traders can easily include beta in our scanning process.
For instance, this next image shows how easy it is to include beta as part of the search criteria when using the free version of Finviz.
Figure 2

As the image shows, when the “All” tab is selected, you’re able to see all of the criteria that can be included in your search for free.
Then, when you select the “Beta” pulldown menu in the bottom left of the screen, be sure to choose any selection that is less than 1.0 in order to find trade ideas that are less sensitive to pullbacks than the S&P 500.

Comments are closed.


5 Comments
Attractive section of content. I just stumbled upon your
website and in accession capital to assert that I acquire in fact enjoyed
account your weblog posts. Anyway I’ll be subscribing to your augment or
even I success you get entry to consistently rapidly.
I like your daily the hottest trading ideas articles. Thanks!
Thank you.
Thanks, Jeff! This is really helpful information. KD
Good information
thanks