If you’ve been following the market closely over the last few weeks it has been the strength of meme stocks.
What’s been even more impressive is the size of the gaps many of these stocks have had.
That’s why I want to take some time with you today and explain what are gaps, the six main types of gaps, and how traders try to take advantage of them.
What Is a Gap?
A gap is an area where the price of a stock moves sharply up or down. Gaps occur because of fundamental or technical factors that are influencing the stocks.
They are typically found around periods of news or earnings that drive the price away from where it closed the day prior. For example, if a company’s earnings are much higher than expected, the company’s stock may gap up the next day.
For day traders, a gap is a highly anticipated momentum signal. Every day these traders have the same focus. Find the biggest gappers, search for a catalyst, add to a chart in your grid, and execute trades when momentum picks up.
6 Types of Gaps
There are 6 fairly common types of gaps that can occur in a stock chart, with each having wildly different outcomes from one another. Get your analysis incorrect, and you could be placing yourself on the wrong side of the markets with very little time to exit the trade.
Gaps can be classified into 6 groups:
- Breakaway gaps
- Exhaustion gaps
- Common gaps
- Continuation gaps
- Pattern gaps
- M&A gaps
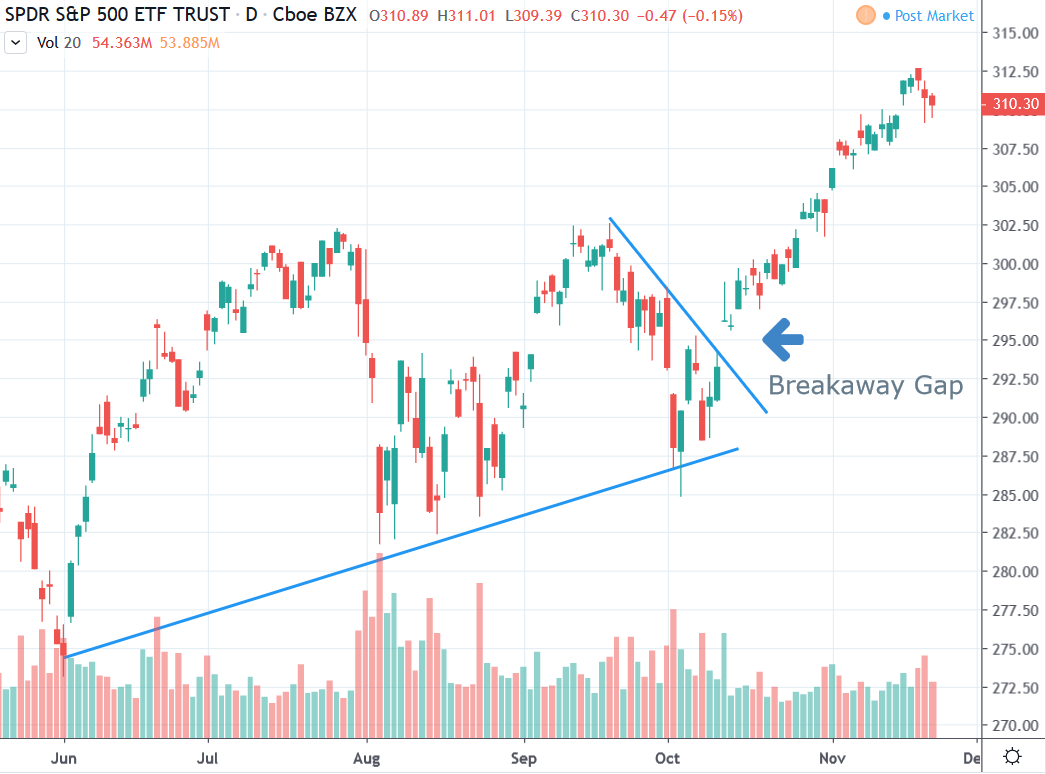
Breakaway Gaps :
Breakaway gaps are typically found at the very end of a price pattern and are typically seen as a shock to traders.
These gaps are typically found when a pattern is coming to a conclusion and buyers (or sellers) stepped in and started the next trend cycle.
In this example, the major triangle pattern is finally being invalidated by traders and a new direction is being declared.
Continuation Gaps :
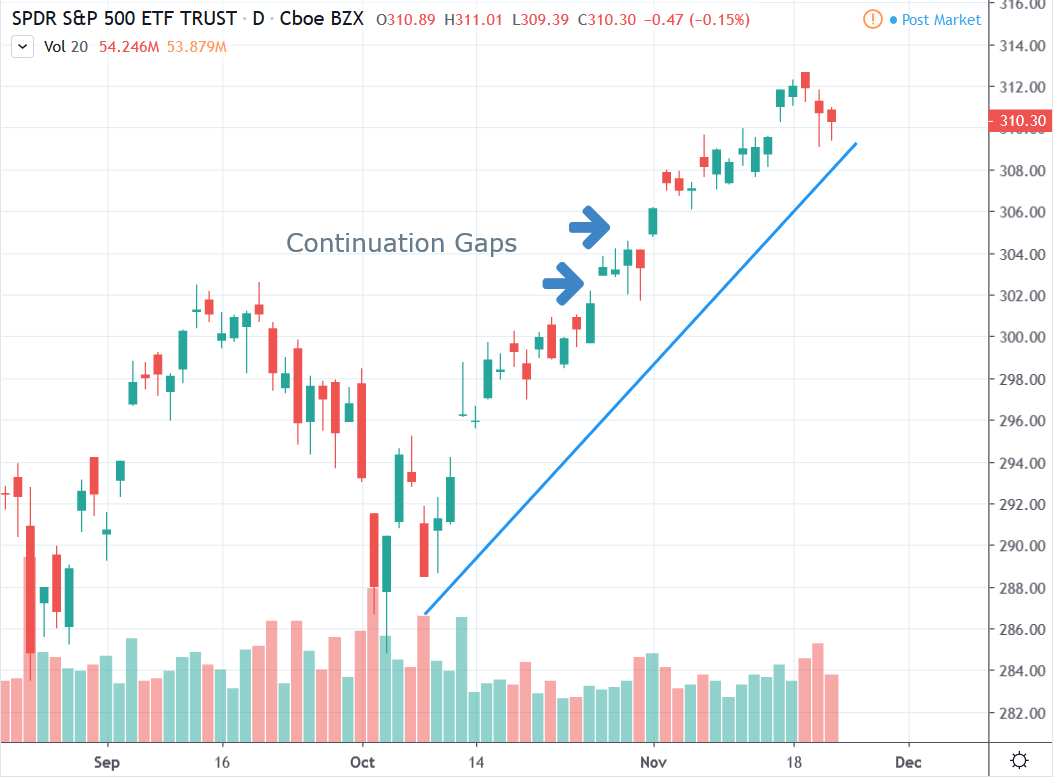
Continuation gaps are also known as runaway gaps.
These gaps occur in an already existing pattern signaling a rush of buyers (or sellers) who believe the stock is continuing the current trend.
This is typically fundamentally driven and has outside influences other than technical trading patterns. It is usually assumed that cash inflows are being rushed into the stock from major investment banks or institutions trying to get on the bandwagon.
Exhaustion Gaps :
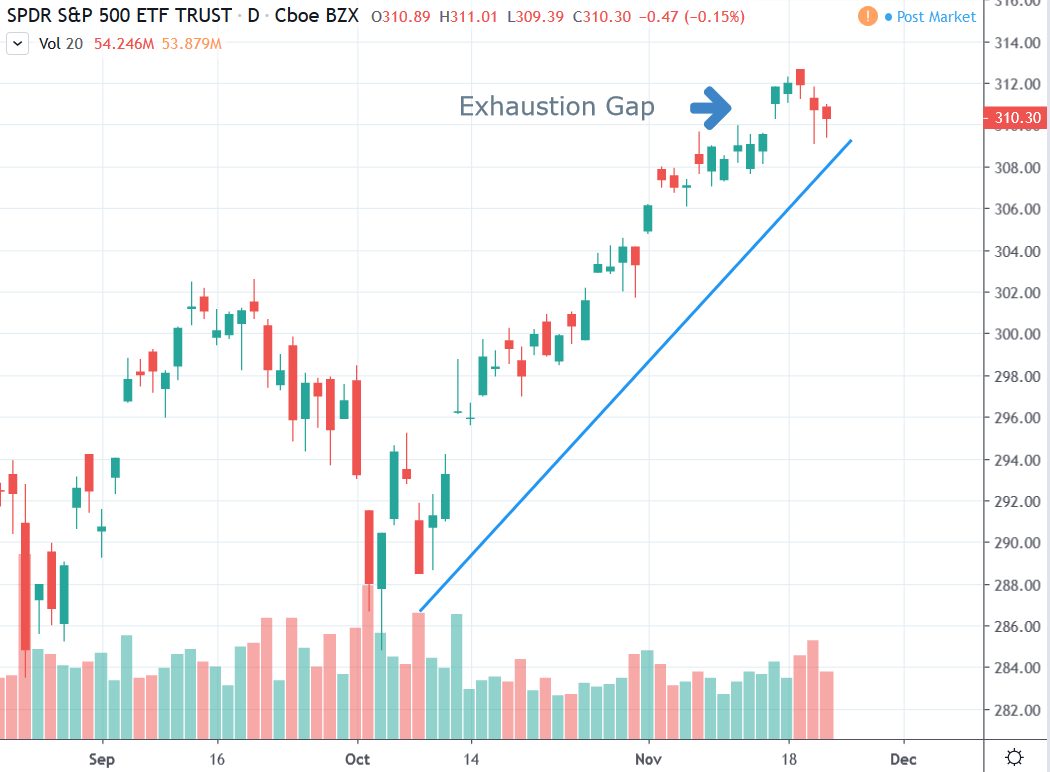
Exhaustion gaps are typically found at the very end of a price pattern when buyers (or sellers) are stepping in to attempt starting a new trend.
These gaps are usually a final attempt by the controlling side to force the stock to new highs or lows and cause traders to exit their positions.
Exhaustion gaps by definition are almost always found at stocks highs and lows and are difficult to navigate since they are only noticed in hindsight.
Traders regularly confuse exhaustion gaps with continuation gaps while looking at stocks. This confusion is because the gap tends to support a viewpoint from the trader and helps confirm a market reversal at the top or bottom of a trend.
Common Gaps :
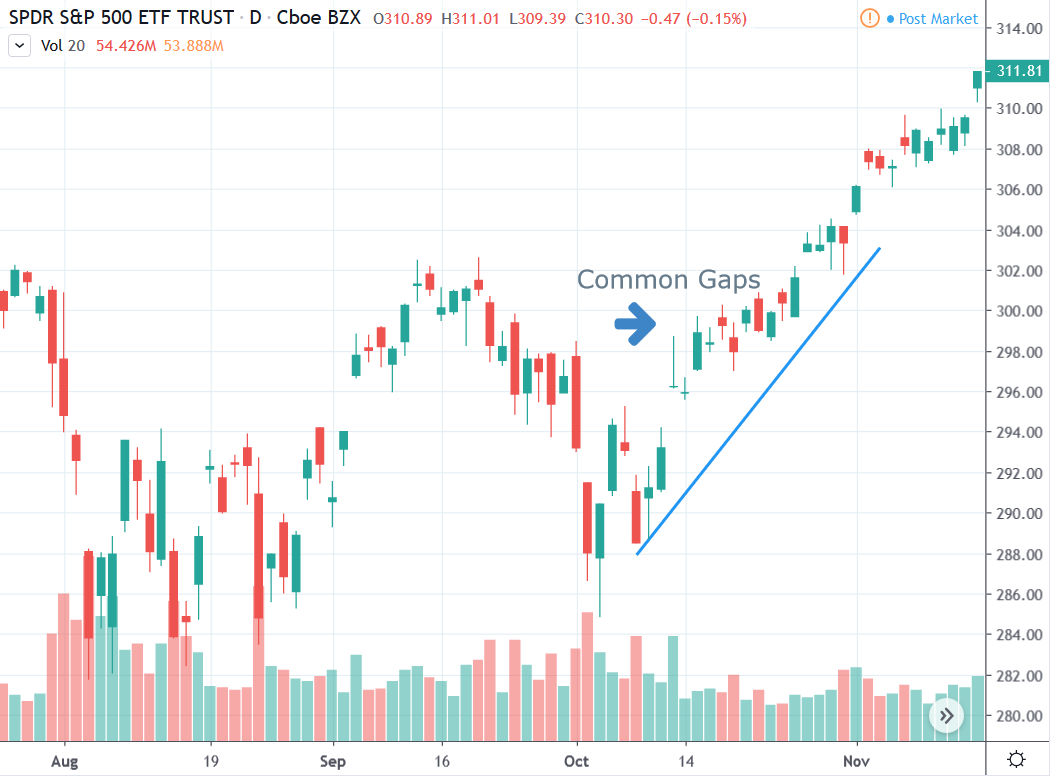
These are also called “everyday gaps” because they occur every day. This is due to overnight chatter, news, and stocks settling out in the closing rotations.
The common gaps don’t typically tell much of a story and are difficult to gain any insight from.
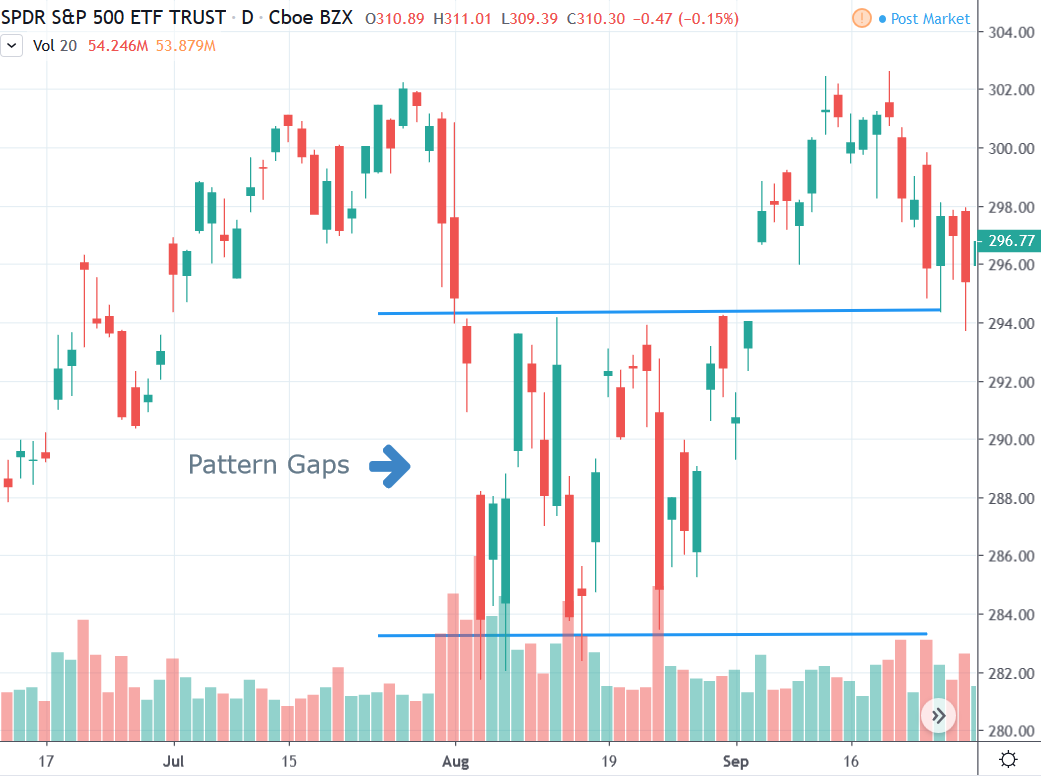
Pattern Gaps :
Pattern gaps are usually extremely volatile and sporadic in nature. They tend to form at or near market tops or bottoms due to the active fighting for direction between the buyers and sellers. Pattern gaps are sometimes also called Common gaps, and tend to be larger in size.
I stay away from pattern gaps as there is no trend or direction chosen and it is extremely easy to be caught on the wrong side of the markets.
M&A Gap:
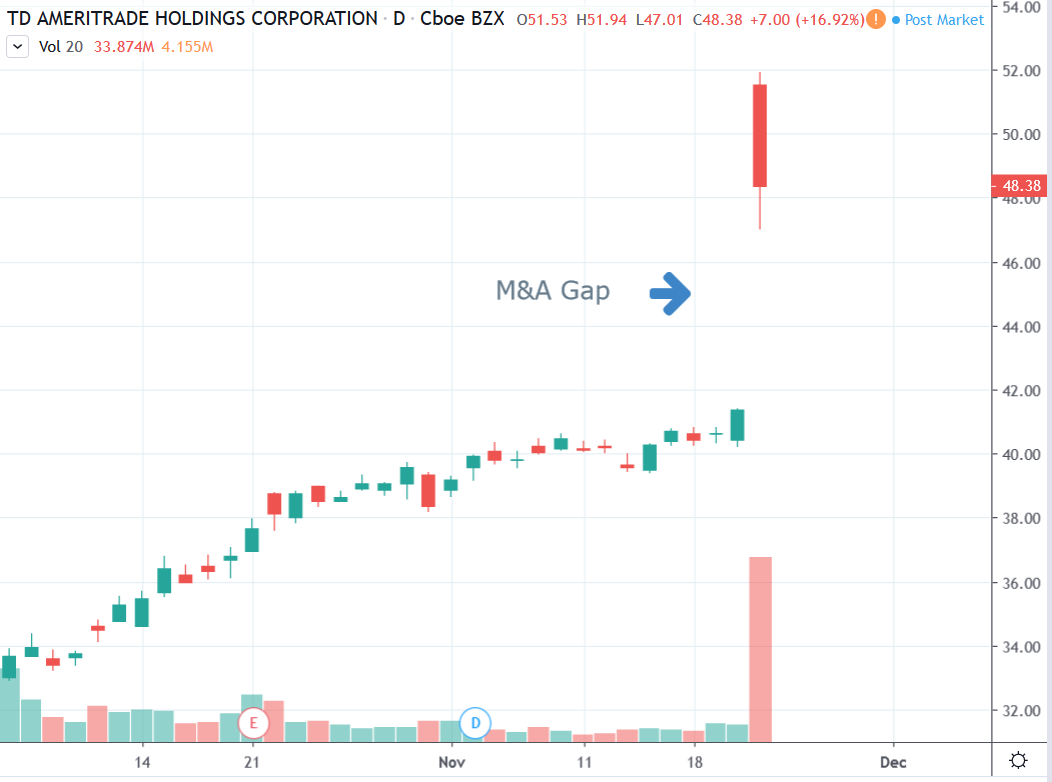
Merger and Acquisition gaps occur around news and other corporate takeover events. These gaps are typically generated from buyout rumors, buyout deals, and FOMO trading from retail investors since all major news outlets are publishing headlines on this stock.
Here is an example of TD Ameritrade that gapped higher based on M&A news overnight. As expected, there was immediate selling in the stock as traders took profits and sellers stepped in to drive the stock lower.
Trading the Gap
Now that each gap is identified, let’s take a look at two different ways you can trade the gap.
Each trader has their own idea of why a gap was formed and which direction it should take. Every gap tells its own story and therefore bears a different meaning to each trader who analyzes it.
There are two categories that you can trade a gap.
- Gap Continuation
- Gap Fading
Gap Continuation:
Gap continuation is a trade that continues in the direction of the gap. Usually gaps will continue their trend only when it’s a healthy market and the primarily buyers (or sellers) want to remain in control.
Breakaway gaps and Continuation gaps are typically the only two gap patterns that will have continuation in their price action.
Pro Tip: institutions and large hedge funds will tend to pile into stocks when there is a healthy trend causing these gaps to occur or continue.
Gap Fading:
Gap Fading is a trade that reverses the direction of the gap. This usually occurs when a trend is becoming exhausted and stall out. Gap fades are typically seen at the top or bottom of trends and the opposite direction is about to begin.
Exhaustion gaps and M&A gaps are typically the only gaps that tend to fade.
Fill The Gap
Is it common for gaps to be filled? Yes and no.
Depending on the type of gap and the strength of the move, it’s possible for a gap to be filled. Both of those factors will determine if the gap can be filled that same day or if it will require more time. The speed at which a gap is filled usually depends on the ‘shock’ the gap produced in the chart.
Pro Tip: Some gaps are so strong that they can destroy technical patterns and invalidate setups.
Why are gaps filled?
It’s important to remember that gaps are caused by emotion. Due to human emotions there are many different factors that impact a stock. It’s always hard to know if a stock will fade from the open or just continue in the new direction. When a gap is filled it usually boils down to a handful of reasons.
Gaps are filled from 3 major reasons:
- Irrational exuberance
- Technical resistance
- Price patterns
Irrational exuberance :
When the initial spike in price may have been overly optimistic from FOMO traders getting into the breaking news. They are exiting the trades with either a quick profit or after they have realized they made the wrong decision.
Technical resistance :
Common when a price moves up sharply. If a stock gaps up into technical resistance, it has a higher probability of reversing and filling the gap to the downside. Some examples of technical resistance are trendlines, technical patterns, support and resistance zones, 52-week high and lows, etc.
Price Pattern :
Important since it gives the trader the “bigger picture” as to what the stock should be doing. Price patterns are typically used to identify exhaustion and continuation gaps.
Comments are closed.


4 Comments
Thanks for the very useful information.The market is so huge its impossible to figure it out. Fasinating to watch! Thanks Jeff for sharing! Pat
thank you i have learn a few things sent been a new trader,, but can someone pleas answer a easy question for me an i can not get answer yet an i have been looking an asking for a few weeks now about 6 weeks now,,,, Why does the volume goes up an stock prices stay the same or the oppsite why does the stock goes up an the volume goes down can someone pleas answer this so i do keeping loosening money pleas HELP thank you
Notify me if you offer a trading program on gap trading.
Very informative