Picture this, it’s the late 1700s and you are a successful merchant during a time when trading soft commodities like rice and grains in the open free market was the big league of trading.
But all this face-to-face, cut-throat transacting was taking place without the help of some sort of system to track the price history of these commodities.
Enter candlestick patterns, which, as some of the earliest evidence suggests, were created by a rice merchant, Munehisa Homma, during this early period.
Guess what?
Candlestick charting has become far more advanced than the days of plotting prices by hand with a goose feather pen, on paper made from recycled cotton and rags.
At its core, though, this form of charting the price movement of assets remains a staple for traders who want to identify when big changes in sentiment have occurred.
So today I am going to show you how to determine just how important this past Monday’s “hammer” candlestick reversal day, by combining it with a bunch of technical tools.
With key earnings reports from the likes of Apple (AAPL) and Boeing (BA), growing geopolitical tensions, and the latest FOMC policy meeting, the market had a lot to digest this past week.
Therefore, to see the market start to stabilize after the gut-wrenching price collapse that we saw coming into this week is certainly a constructive sign.
And marking the start of this stability was Monday’s “hammer” reversal candle session.
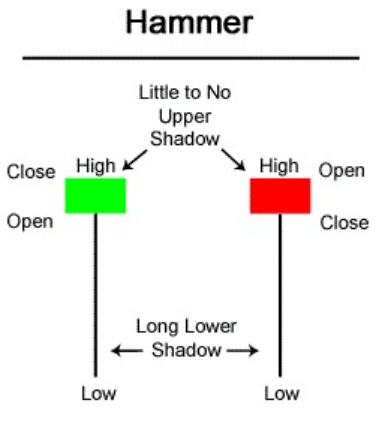
Hammer candlesticks are reversal patterns that form when a stock’s price falls to an intra-day low that is far below the opening price, then rallies to close near the highs of the day.
Here’s a picture of what that looks like, along with the names of the important elements of this pattern.
First and foremost, hammer candlestick patterns are important because they signal when an important shift in sentiment, from bearish to bullish, has occurred.
Their effectiveness is usually highly dependent on the following key technical factors:
Did the hammer reversal form when trend mechanics were still strong?
Did the formation occur when momentum conditions were either deeply oversold or positively diverging?
Did the reversal pattern occur at major support?
Did the hammer develop after the price fell an unusually large distance from an important moving average?
Did the hammer develop at either a seasonal or a Fibonacci cycle turning point?
I will tell you first hand that when all of these conditions are present when a hammer pattern forms, it usually results in a much more reliable and powerful signal that prices are poised to continue to rebound.
So let’s see what kind of technical conditions were present when this past Monday’s hammer formed.
Before we get started, I will tell you that we are going to find a mixed bag of results that leans toward the market being closer to a bounce than THE bottom.
Let’s start with the trend mechanics:
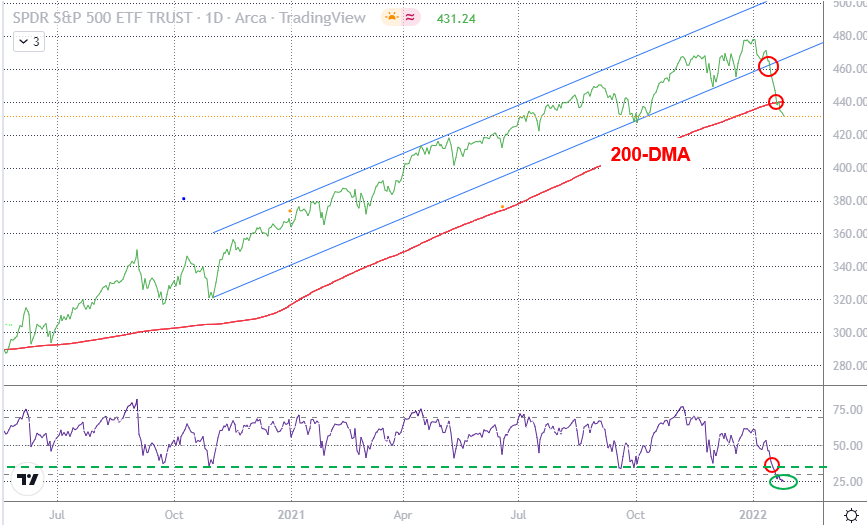
Figure 1 shows that at the time of Monday’s strong reversal, the S&P 500 ETF’s (SPY) trend mechanics were not good, after crashing below a long-term price channel and 200-DMA recently, along with the all-important RSI falling below the low-end of its bullish range (35 – 40). That’s one negative.
Digging a little deeper into Figure 1, however, we see that the RSI momentum indicator had become quite oversold on Monday. That’s one positive.
Figure 1
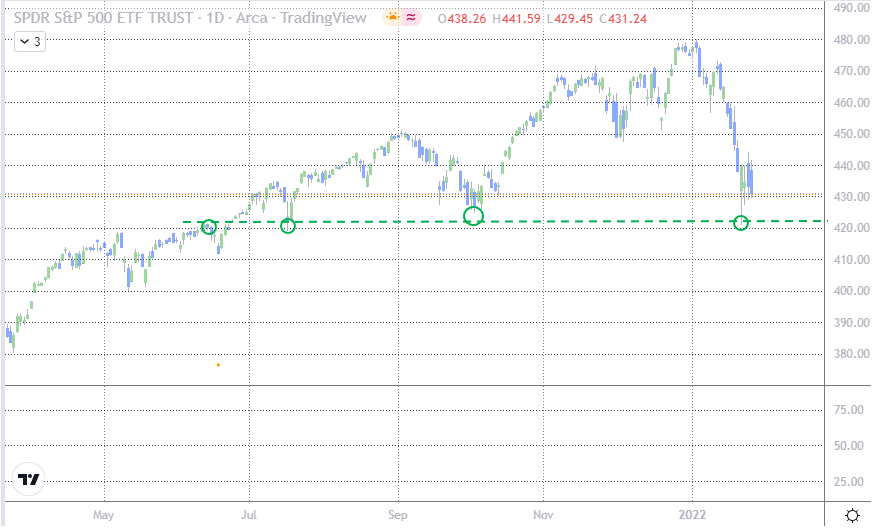
Next, Figure 2 reveals that SPY found the buyers necessary to cause Monday’s hammer rally at support provided by a previous area of demand (support) that dates all the way back to June of last year. That’s another positive.
Figure 2
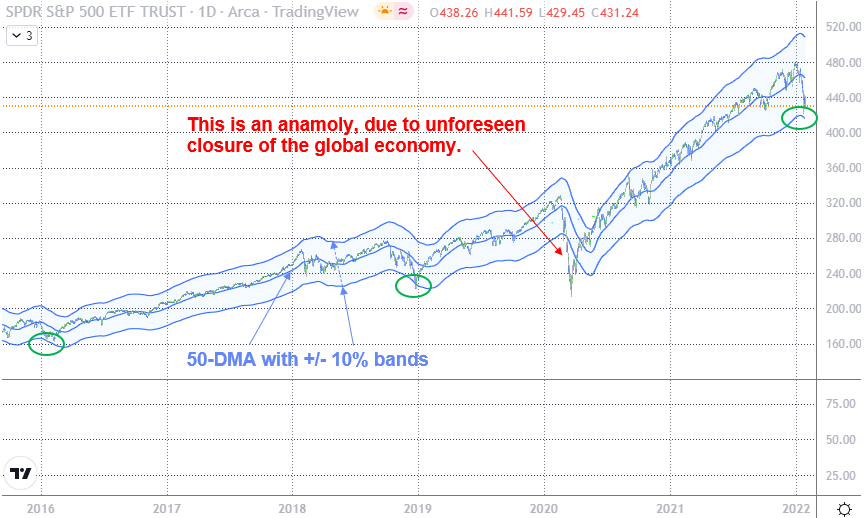
Moving on, Figure 3 uncovers another positive, which is that the S&P’s drop from its all-time highs of late last year had stretched to 10% below the widely followed 50-DMA.
Why is that relevant?
Well, in the past I have explained that every security, whether it be a stock, an index ETF, a commodity, or a currency, has its own volatility personality that it rarely deviates from.
As Figure 3 shows, with the exception of the COVID collapse, which is an outlier that should be ignored for this analysis due to the global economy being shut down without warning to the general public (don’t even get me started on how our elected politicians were alerted to the pending shutdown and therefore were able to sell stocks before the collapse), the S&P tends to start to stabilize after falling by this percentage. Another positive.
Figure 3
Finally, did Monday’s hammer form when some form of cycle turn was due?
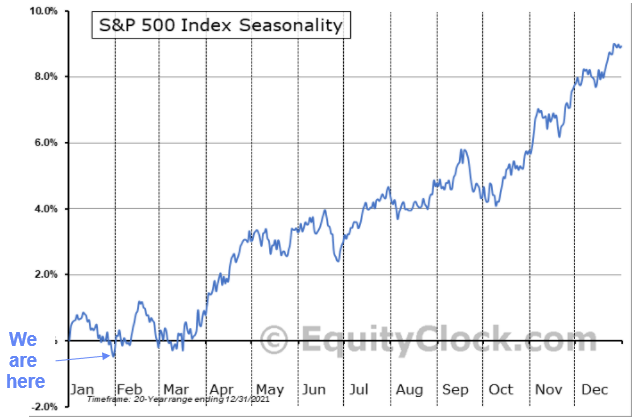
Figure 4 rehashes on a chart I like to follow, which shows the S&P 500’s average seasonal pattern, broken down by month, over the past 20 years, and what you see is that a seasonal turn, from bearish to bullish, is due to start next week. Another positive.
Figure 4
Bottom Line
At its most basic level, technical analysis measures the balance between supply and demand. In recent years, we’ve witnessed a massive shift to where the market pays more attention to the technicals for trading signals than it does fundamentals. Fundamentals are still the key driver of long-term trends, but the market’s technicals are what we need to pay attention to for timing signals.
Right now, everything I’ve shown you today is that the market has found an area that is important, and that is reflected in the sentiment shift that came in the form of Monday’s hammer candlestick.
If buyers do not show that they are willing to start stepping in more aggressively next week, causing SPY to slip below this past Monday’s hammer low, traders should be extra cautious and aware that a more complex bottoming process may be in the making.
Comments are closed.


2 Comments
you could be right about this.
Excellent Analysis! How to grow savings based on this?