

There comes a time in every trader’s career when they finally understand how markets really work.
It’s a magical milestone that, when reached, leads to vast improvements in one’s capital allocation decision making.
While there are constantly alpha-generating opportunities to be found in stocks of all shapes and sizes, knowing which opportunities are poised to continue leading the broader market is an ability that develops after much practice and study.
Perhaps more importantly, being able to identify which opportunities are ready for immediate outperformance, allowing for little to no opportunity costs (i.e., the potential benefits an investor misses out on when choosing a stagnant or underperforming investment).
Today, I’m going to walk you through some of the opportunities that are developing as a result of some critically important market rotation that is taking shape right now. In addition, we’ll discuss how you can monitor this rotation on your own, and how it may affect your upcoming trade decisions.
News does not drive markets
Believe it or not, news does not drive price trends.
Sure, there’s often an initial market response that occurs in the wake of an important headline.
But, it is very rare for this news to alter any trends that have been in place prior to its release.
Instead, when we’re talking about multi-week-to-month trading cycles (as opposed to multi-year secular trends), intermarket relationships and positioning are often the big factors that drive trends.
What is Intermarket Analysis?
In layman’s terms, intermarket analysis is a method of market research that monitors cross-asset relationships for any signs that a change in market direction might be coming.
For example, you may remember headlines from earlier this year about how rising interest rates had put some pressure on US equity prices, particularly large technology companies.
Or you may have heard that a surging dollar usually puts pressure on commodities prices.
Well, these are examples of intermarket forces at work, and learning how to measure these forces can become one of the most valuable skills a trader can develop over his or her career.
Interest rates are starting to rise again
Recently, interest rates have begun to spike again, leaving many strategists to wonder if inflation is about to rear its ugly head again after the deflationary pause we’ve enjoyed since early April.
While inflationary market rotation is good for some sectors, and we’ll discuss those in a moment, it is not friendly to the large tech companies and other popular growth companies that so many of us have loved to trade in recent years.
Perhaps two of the most important drivers of intermarket cycles are the US dollar and interest rates.
Fluctuations in both can have either beneficial or detrimental effects on the earnings power of a wide swath of companies.
For example, a strong dollar can hurt large multinational US-based companies because it raises the cost of products provided by these companies, thereby making them relatively unattractive vs. those of foreign competitors whose goods have fallen in price as a result of their currencies being depressed by the rising dollar.
Another example, and one that is at the core of today’s discussion, has to do with fluctuations in interest rates.
The yield on the benchmark US 10-year Treasury contract has been on the rise recently.
Why is this a concern?
Well, for a number of reasons.
….You see, there is a large market contingent that does not believe the Fed’s story about inflationary pressures being mostly transitory.
So, the concern is that the decline in rates we’ve enjoyed since early April was just a respite ahead of what may become another leg higher in rates that lasts well into 2022.
While this is just speculation at this point, we do have to keep a very close eye on this market for signs that the trend may be starting to turn in that direction.
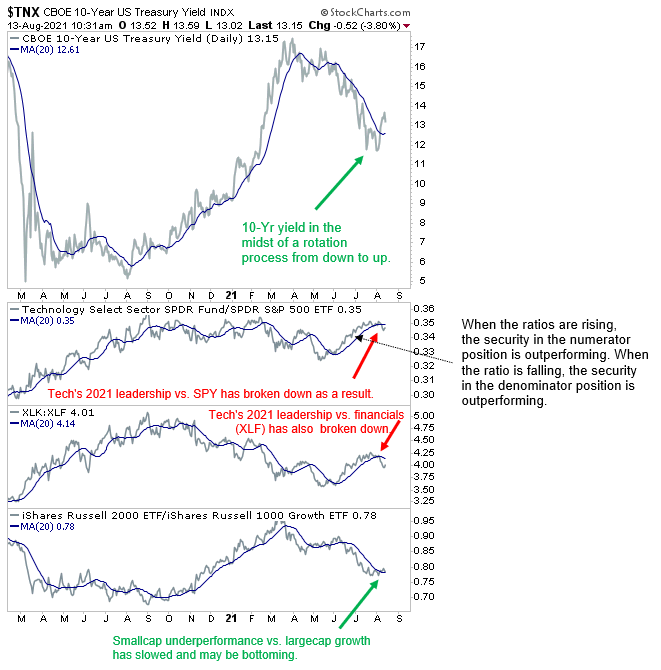
As Figure 1 below reveals, large fluctuations in interest rates have been the key driver behind periods of leadership and underperformance by two important sectors, tech and financials.
In addition, as the bottom panel shows, interest rate cycles carry a lot of weight in the relationship between smallcaps and largecap growth stocks.
There are other sectors that have been affected by these gyrations; however, these are the two sectors that we’ll be focusing on today.
Figure 1
How do interest rates affect stocks in these sectors?
Large growth stocks like those that influence the movement of NASDAQ -100 ETF (QQQ) are valued based on future discounted cash flows.
Therefore, if stocks are valued based on future discounted cash flows, and the discount rate is zero, then it doesn’t matter if investors see that money one month from now or 10 years from now.
Of course, interest rates are still just one, albeit an important, part of a complicated equation. An equation that uses more than just hypothetical future cash flows and today’s discount rate.
When it comes to financial stocks, the explanation is perhaps easier to understand.
In layman’s terms, when interest rates are higher, banks make more money by taking advantage of the difference between the interest banks pay to customers and the interest the bank can earn by investing.
How can traders monitor this rotation?
What I’ve shown here today is early evidence that the recent rebound in interest rates has already begun to weigh on the relative performance of popular tech companies and other large growth stocks while boosting the performance of stocks in the financial sector.
From a technical perspective, the key is to understand that, so far, an official reversal of the post-April decline in interest rates.
At the same time, though, there is clearly an intermediate term bottoming process taking shape in interest rates, which has caused big tech’s aggressive leadership since March to start breaking down.
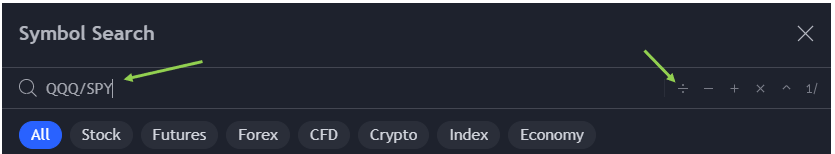
To monitor these developments on your own, it is always good practice to chart the relative strength ratio between a tech-heavy index like QQQ or XLK (S&P 500 Technology sector) vs. the benchmark S&P 500.
To do this in Tradingview, enter the first ticker (in this case QQQ) then select the division sign (see pic below), then enter the ticker for the benchmark (in this case SPY for the S&P 500).
Figure 2
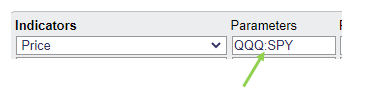
To do this in Stockcharts.com, enter the first ticker (in this case QQQ) then type a colon (see pic below), then enter the ticker for the benchmark (in this case SPY for the S&P 500).
Figure 3
Conclusion
When markets are witnessing a trend transition, it is a process that can take several days-to-weeks to play out.
Right now, as this transition process in interest rates continues to unfold, traders should avoid overweighting large, growth companies like the big tech companies so many of us have loved trading over the years.
Failure to heed this warning could miss opportunities elsewhere as positions stagnate vs. the sectors that are slated to benefit from this rotation over time.
As we discussed in this commentary, those sectors are small cap companies and financials.


1 Comments
HOW VERY TRUE; THANKS FOR REINFORCING WHAT I’M LEARNING!7