Hello Trader,
Picture this: It’s 8:32 a.m. in New York and S&P 500 futures are already down a whopping -2.6%.
Oh, wait…that already happened.
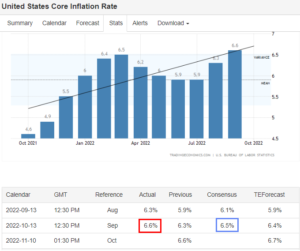
Yup, that’s what the investment world was facing in the wake of this past Thursday’s HOTTER than expected CPI data.

And what were you doing?
If you were short, you were probably ecstatic!
And if you were long?
Well, we don’t need to revisit that moment, do we?
In either case, I am willing to bet that you had no quantifiable idea of where the selling might stop.
That’s where a 20+ year market veteran like me comes in!

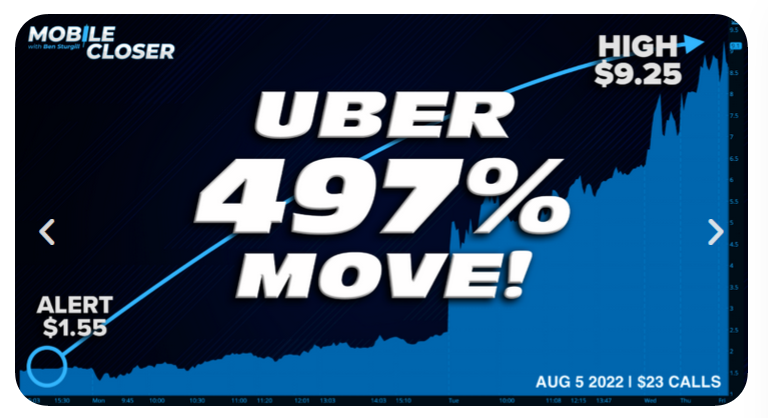
Hey, before I continue, Have you seen the MASSIVE moves my man Ben Sturgill has been finding for his Mobile Closer members?
I mean, just look at this WHOPPER in UBER!

Well, GUESS WHAT?
Ben has NOW been aurthorized to grant you access to this HUGELY popular service at a 60% DISCOUNT!
And on top of that, he’s also including BOTH of his SMART MONEY SCANNERS (that’s the Dark Pool and Unusual Options Activity Scanners) as part of this offer.
Folks, if you don’t recognize how AMAZING this offer is, it might not be for you.
But the offer ENDS SOON, so you must act NOW!!!
I’ve been in your shoes
Yup, I was a beginner trader JUST LIKE YOU at one point.
But I learned early on that extreme market moves have limits.
Does the stock market have days when it absolutely collapses more than it did at this Thursday’s open?
Absolutely!
However, such instances are VERY rare, and you MUST have someone who knows this business to teach you these facts.
Not only that, you have to realize that the market moves within measurable limits.
YOU are not alone out there.
I’ve developed a custom volatility strategy that tells me when the market has stretched too far, making the odds of a reversal increasingly likely.
Folks, this is ACTIONABLE information that YOU MUST HAVE.
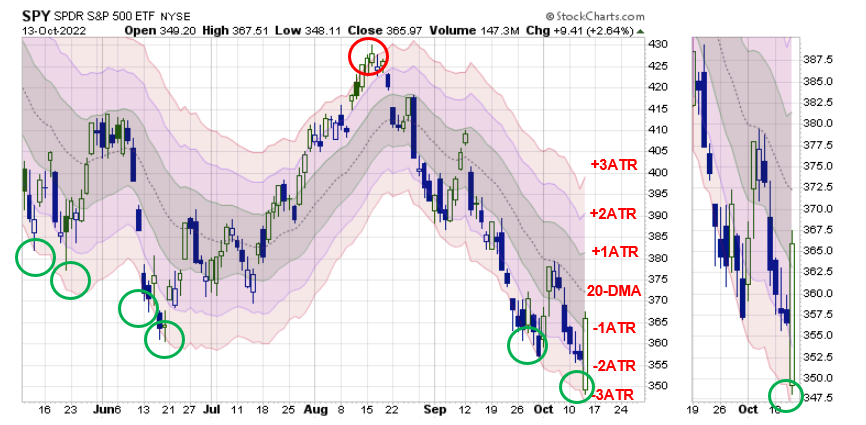
Here’s what it looked like on Thursday.

Friends, this is my CUSTOM Keltner study, where I use 3X the ATR (Average True Range) Bands to tell me when price has moved TOO far for the move to continue.
Just look at how it helps identify areas where big swings are likely to occur.
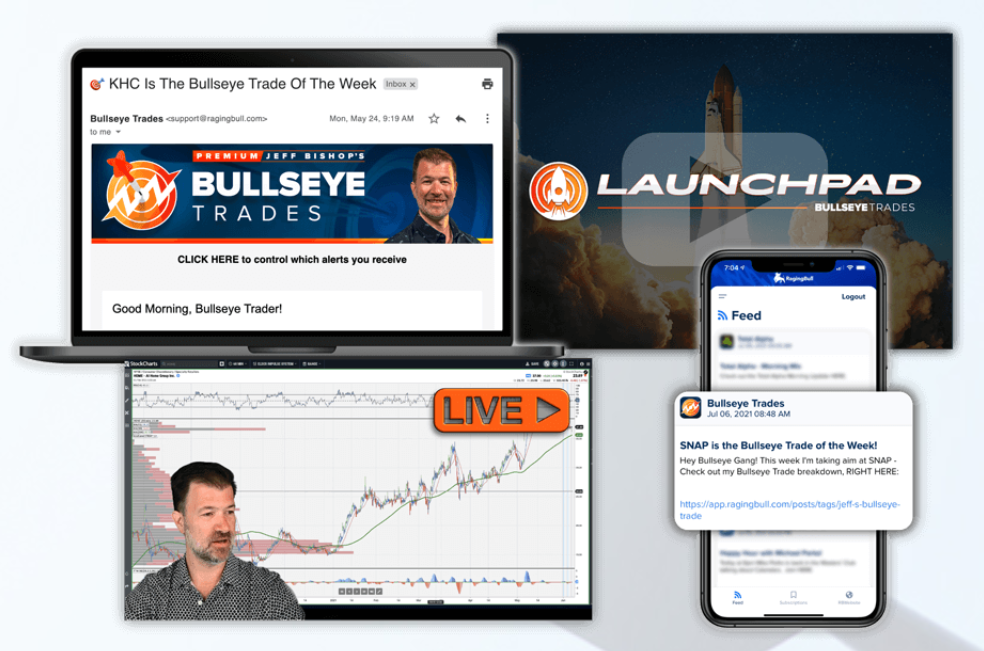
And the HANDS ON GUIDANCE I provide to members comes throughout the trading day, via every platform possible.

RIGHT NOW, I’m authorizing our sales team to offer this service with an UNBELIEVABLE MONEY BACK GUARANTEE!

Have questions or simply want to talk? Just call: 800-585-4488
However you decide to do it, you have to do it before I reveal my next BIG trade idea in this UGLY market before trading starts on Monday morning.
I’ll tell you a little secret, I am still playing this market with a BEARISH mindset.
So keep your eyes open for a BIG event I’m having next Thursday that will tell you all about my strategy for surviving what’s to come!!!
To YOUR Success!


