

Franklin D. Roosevelt once said: “There are as many opinions as there are experts.”
Something similar is true about the stock market – there are just as many strategies and ways to trade it as there are traders.
We may be entering the same name and for similar reasons, but still, we all run our own sets of indicators, tools, and thought processes.
I, for one, try to go into great detail explaining the things that matter most to my style: Moving Averages, ATRs, Oversold & Overbought areas, different types of advanced options trades, to name a few.
But then, there are a few really basic things that, in my view, lay the foundation and cover the basics for a great number of intraday strategies.
Let me share with you 3 data points I always look at, before making any major trade decisions.
Volume
Volume is simple – in fact, it’s possibly the simplest and most basic stock metric a trader can look at.
Yet, oftentimes, it may be among the most important ones out there for a short-term trader.
See, volume is your quickest and most reliable way to assess 2 key characteristics of a move: liquidity and the bigger picture investor sentiment.
If we’re talking liquidity, one part of it is obvious: the more shares change hands, the greater number of people participate in the move, and the easier it will be to get in and out of a trade.
Liquidity matters a lot when trading small-cap names, even if your account isn’t very big – trust me, it’s never fun to get slipped 5-10c even on a low share count.
The second part ties into the “bigger picture investor sentiment.”
See, as a move is happening and a stock is advancing – you’d generally want to see the volume pick up as well.
This signals one major thing: more market participants, big and small, are accepting the new price point and are willingly getting involved.
If you look at most major movers, you’ll notice the volume has been on a steady uptrend as the move developed.
Before I enter a trade, I always check the longer-term chart to get an idea of volume history and and assess whether it’s in an uptrend or a downtrend – that way I know if interest in a stock is rising and if new price levels are getting accepted by an increasing number of people.
Long-Term Price Levels
As you sit glued to your screens, watching every tick and counting every penny, it’s very easy to get caught up in the moment and lose track of what’s going on in the bigger picture. And in trading, the big picture does matter quite a lot.
A common mistake I see newer traders make is focusing on immediate price action and failing to note and mark important longer-term chart levels – areas where a stock is likely to find support or resistance in its intraday moves.
You may be entering the cleanest looking intraday breakout higher – only to find out there is a major long-term resistance level not far above your entry.
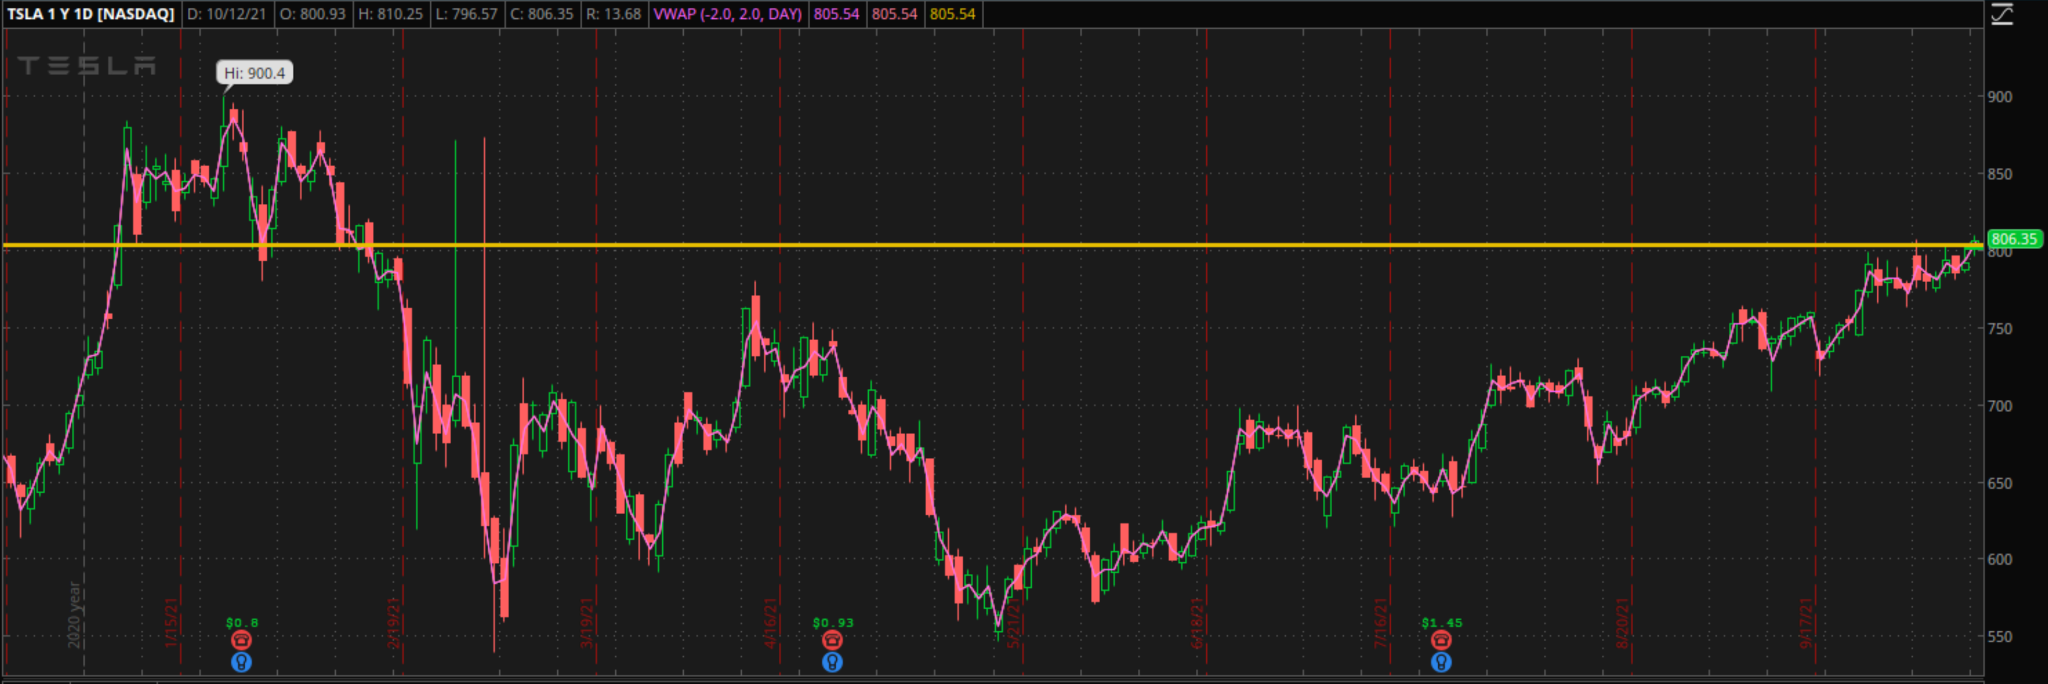
If you’re trading Tesla (TSLA) breakout today, you should know you’re not just fighting yesterday’s high:
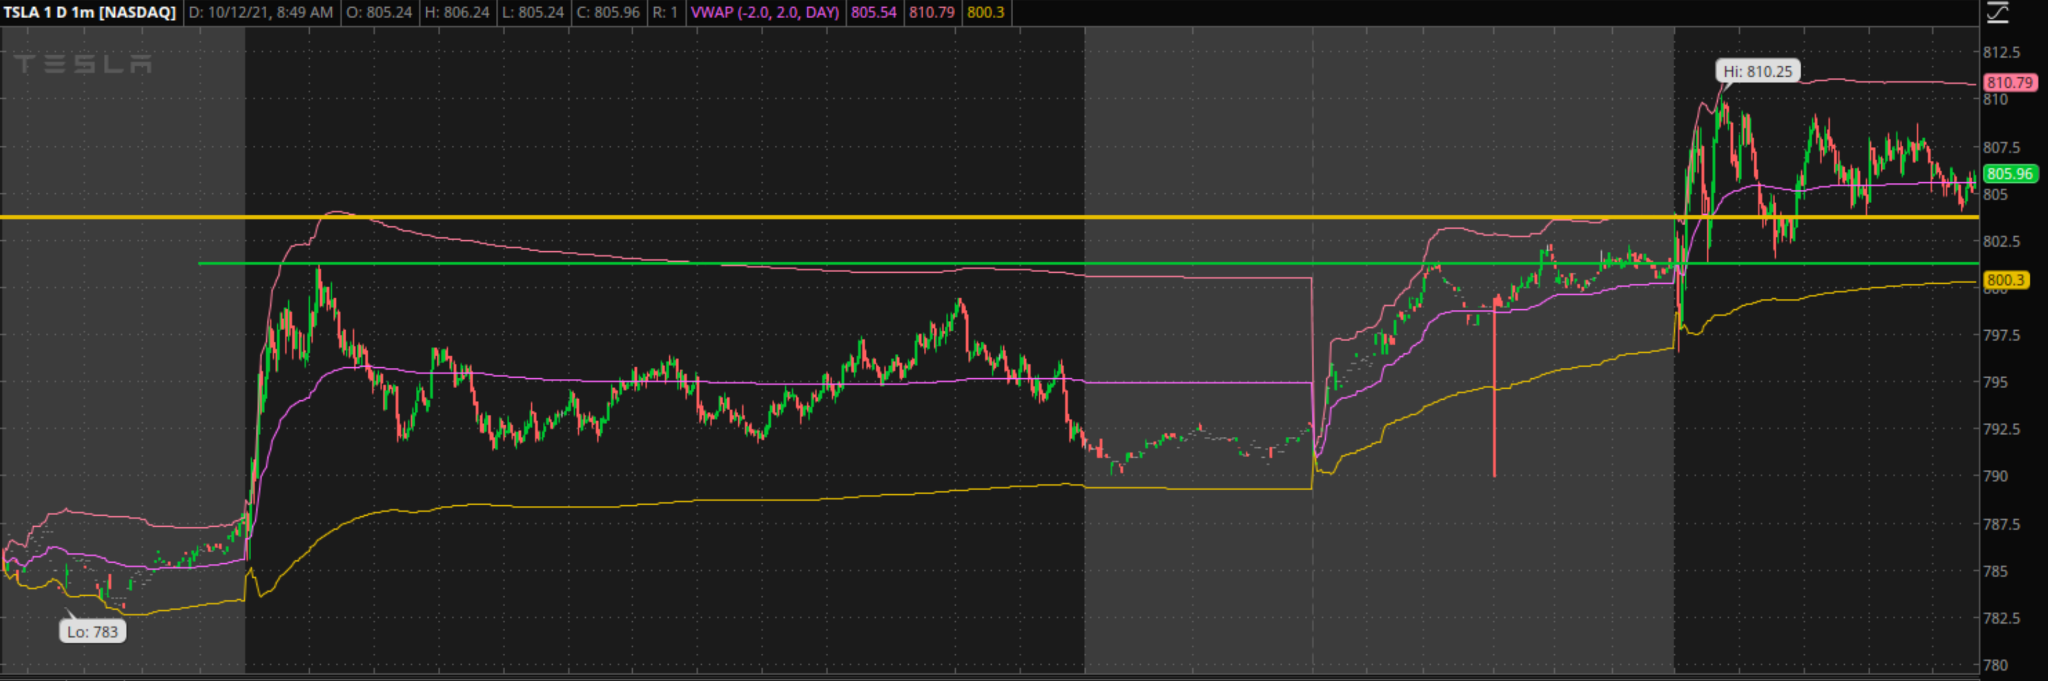
You’re also dealing with a major $804 area from TSLA’s long-term chart:
One thing I’ve made a habit of is to always check the daily and weekly charts, before I enter any trade, and see if there are any major levels in the vicinity of a current price range.
If I find one, I always mark it on the chart, virtually any trading software allows that – this way I have all major inflation points in front of my eyes and know where my stock may have troubles.
VWAP
VWAP stands for Volume Weighted Average Price and it’s one indicator that I think every trader should have on their screen.
VWAP is a product of fairly straightforward arithmetic:
VWAP = SUM All Transactions (Shares * Price) / Total Shares Traded
What you get as a result is the average price at which shares changed hands that day. On a chart it looks something like this:
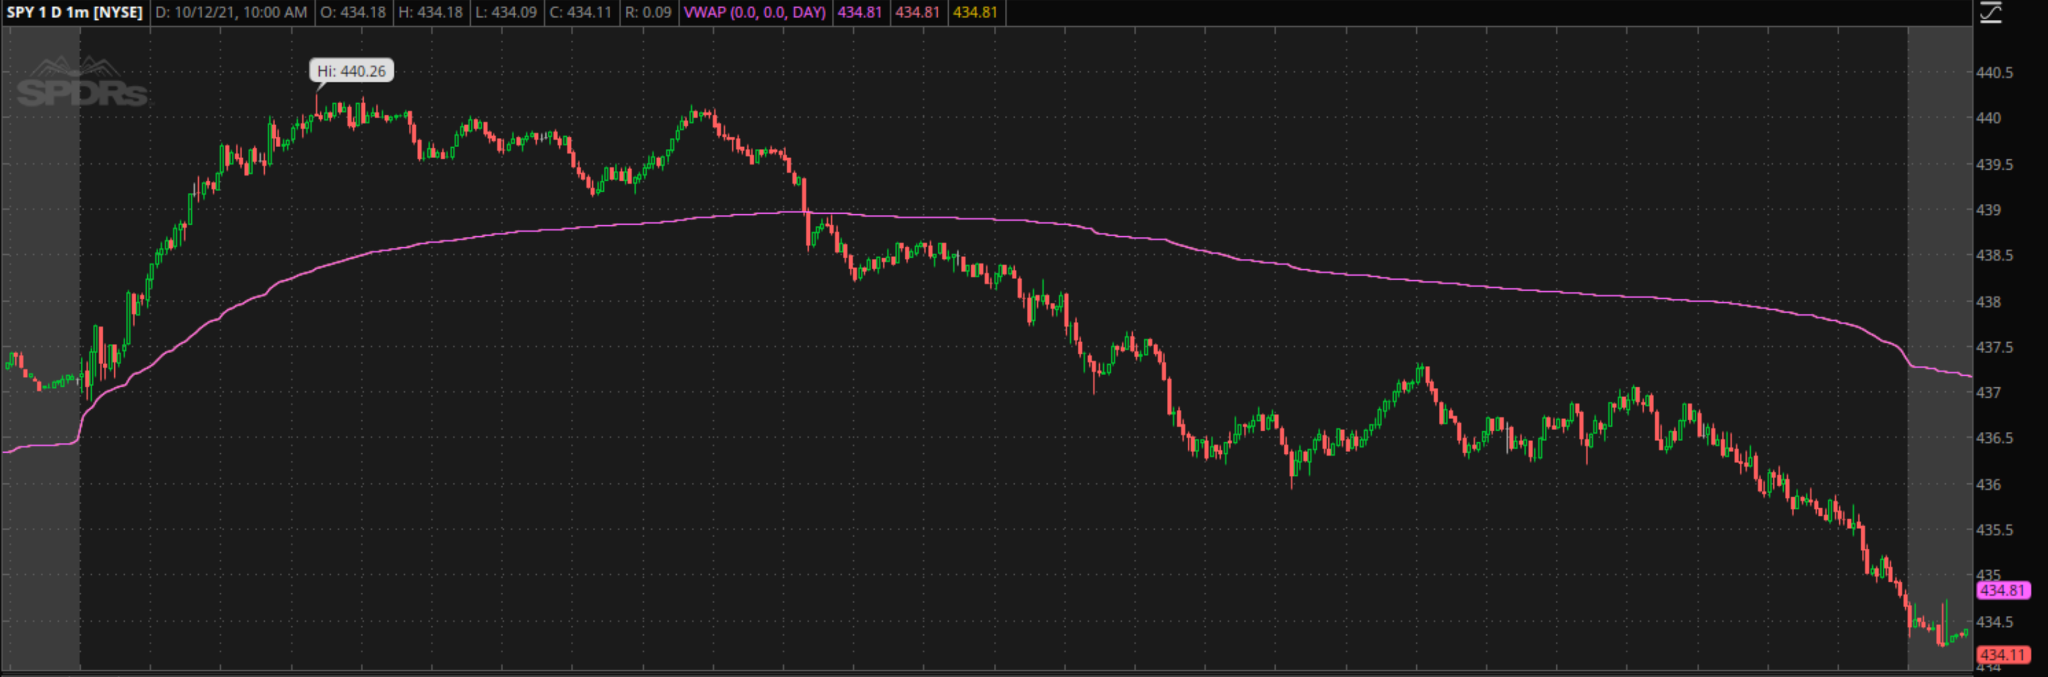
VWAP matters for a simple reason – it can quickly tell you which side of the market is in control.
Think of it this way:
- If a stock trades Under VWAP – your average buyer is underwater
- If a stock trades Above VWAP – your average short seller is underwater
Knowing and understanding this information can be a great insight into the immediate underlying supply-demand dynamic of a stock, and may benefit virtually any trader.


6 Comments
Hi,
Thank you very much, Very interesting. I am trading the SPY and the charting that I am using is TC200 I will make enquiries if they the VWAP indicator.
Thanks again.
Isac Markowitz
Thanks Mr Bond. Very insightful and helpful.
Thanks, J! I’m always learning from you! KD
Excellent article. I’m just coming back into trading after some time away. I was heartbroken by the problems you had earlier, and felt very lost.
Enjoyed reading through this, very good stuff, regards.
Appreciate you sharing, great blog.Really looking forward to read more. Want more.