
Everybody out there talks about trading patterns these days: it’s a flag, it’s a wedge, it’s a triangle…
And I don’t blame them – I, for one, am a big advocate of patterns: I’ve seen some of my favorite setups repeat over and over, and over again.
But look, let’s get real, lines and geometrical figures on a chart don’t make a stock move!
Supply and demand for shares do!
Understanding what forces create those figures and what effect they have on the supply and demand may stack the odds in your favor when trading an “obvious geometrical pattern.”
Allow me to recap one of my recent “pattern trades” and showcase what I mean.
Basics of a Bull Pennant
This past Friday, I had a great trade based on something I’ve seen repeatedly over the years – a setup called a “Bull Pennant.”
A Bull Pennant is what many may consider a classic trading pattern, and from the lines and figures standpoint, it looks something like this:
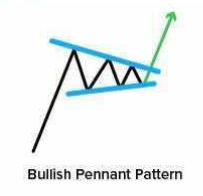
A trader can distinguish it from its sharp move up, followed by a tightening consolidation that, in a perfect world, results in the next leg higher. Such a chart is a fairly common occurrence that many of you have likely seen and even traded.
But not every such image will result in a move higher. So what gave me confidence in my trade?
And how do you tell a pennant that may work from the one that will likely fail?
What Creates a Pennant?
To answer the questions above let’s break the chart pattern down into its 3 key pieces:
- The Pole / Initial Run up:
This one is straightforward: an influx of buyers takes a stock to a new range higher up. Run ups may come from anything: a catalyst, a continuation of a momentum move, or a chart breakout.
- Tightening Consolidation:
This next part is essential, and what I like to call the battle. At this point the stock tries to establish itself in the new range: sellers and short sellers sell all pops, buyers buy all the dips. Eventually the weaker group ends up underwater and has to give up – the winner defines the next move of a stock.
- The Breakout / Fail:
The end move resulting from the battle.
So clearly, when it comes down to the battle, I want to make sure the odds are in my favor.
Now, how do you know who wins the battle?
As with everything in trading, there’s no sure answer, but if I want to go long a Pennant – here are a few things I’d like to see:
- Short Trap: A stock has previously provided an entry to short traders – if it starts edging higher, they’ll be forced to cover causing a break higher
- Small Caps: Smaller names need significantly less of actual money poured in to have a major reaction.
- Stocks under $10: Cheaper stock attract more attention and are easier to buy: any pop in such names may cause many traders to chase an up move, providing additional demand
None of these come with warranty, but they surely may improve your odds!
My PROG Trade
So here’s how it all unfolded: Progenity, Inc (PROG) popped on my scanner early in the morning – the healthcare name was getting a bid in sympathy to many other stocks in the sector.
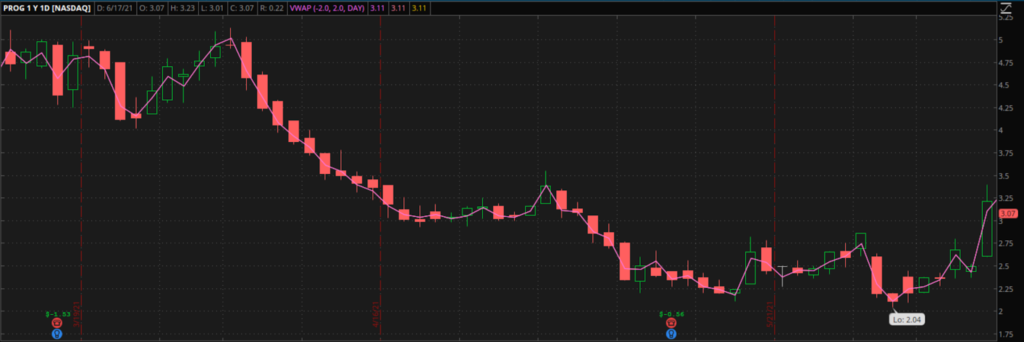
On the daily chart, the stock was trying to crawl out of a consolidation of the past 2 months:
Intraday action was even better: PROG attempted a run on big volume in the morning, but multiple pops got rejected – perfect environment for short sellers to stay short.
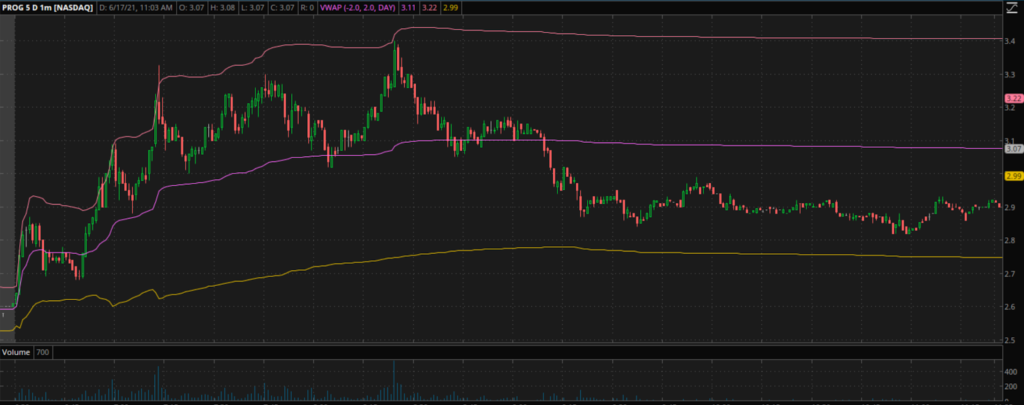
The day went on and up until about 2PM, the stock looked completely finished.
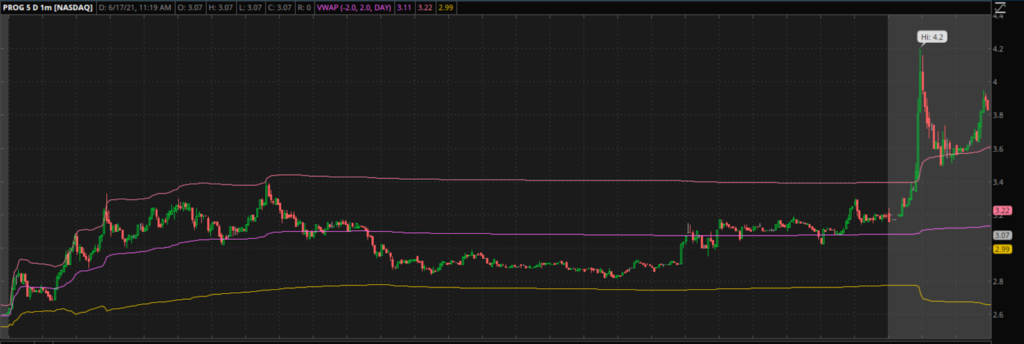
And then, it gave a Bull Pennant:
PROG popped from the $2.8 area right into the $3.10 area, where it wiggled around, as long traders battled short traders.
Now I had a trade decision to make. Does this Pennant have a chance to continue higher?
I went to my checklist:
- Short Trap? Check!
- Small Cap? Check! – at the time of entry, PROG had a market cap of ~$140M.
- Under $10? Check!
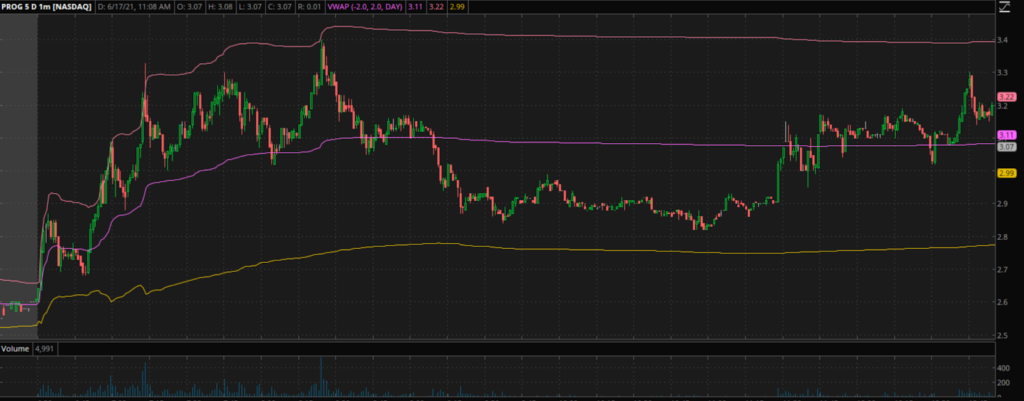
I knew if longs were to prevail, a rush of demand would pour in, ranging from people chasing a breakout higher to short traders fussily covering their positions.
Thus, I bought in at $3.19 right as the name started moving higher into the close, intending to be out below $3.10.
The rest was history: Some half an hour later the stock moved to $4.20 in the after hours, which gave me my exit at $4.01.
I’m not suggesting you use my specific rules – they will not work every time, and they may not fit your trading style.
When you’re trading a pattern— you’re not trading the lines on the screen.
Understanding what they are and how they work may make a world of difference.


2 Comments
Great info Jason! Thank you!
Thanx Mr Jason, you realy are a teacher.