
After witnessing a slow and rather stealthy drip lower during the first half of the month, popular cryptocurrencies like Bitcoin and Ethereum finished July strong, rallying 33% and 37% off their respective monthly lows to finish July in the green.
While July’s 2nd half crypto rally was ignited by high-profile comments made by Elon Musk, Jack Dorsey, and Cathie Wood at the livestream The B Word crypto conference on 07/21, the fact of the matter is there were several technical developments pointing to a potential rally even before this event occurred.
During the seemingly endless journey toward becoming the best traders we can be, one of the most rewarding skills we can learn is how to identify positive technical developments in an otherwise negative tape.
Today, I’m going to walk you through just what those positive technical developments were. In the process, I’m going to introduce you to an amazing free source of government-provided data that was part of this analysis. Finally, I’ll reveal whether the downtrends that have been in place in this sector since the early part of Q2 have reversed or not.
The Smart Play was getting long Bitcoin before the B Word Conference
While it was already widely documented that Tesla owns Bitcoin prior to The B Word Conference, for the first time Musk used this platform to reveal that one of his other companies, SpaceX, also owns Bitcoin.
But this conference wasn’t just a discussion about ownership.
Board members also discussed more important items such as crypto’s viability as a hedge against both inflation and deflation.
And when pressed on whether he’d take crypto payments from advertisers on Twitter the company’s CEO, Jack Dorsey, said he’s open to the idea but he’s more focused on creating economic incentives within Twitter without having to rely on advertisers.
Though some across social media have suggested that this discussion contained some fraudulent claims, it was certainly an interesting discussion that contained some very supportive comments from some of the biggest names in industry and finance.
Even before The B Word Conference took place, there were indications that “smart money” accounts were starting to build long positions in Bitcoin futures contracts.
How do I know this?
Because there is an amazing, free source of government data that’s available to anyone with an internet connection.
The CFTC’s Commitments of Traders report is an excellent free resource
Sentiment plays a critical role in determining when market cycles may have reached extremes.
Some of the best indicators are built with the information provided in the Commodity Futures Trading Commission (CFTC)’s weekly Commitments of Traders report when it comes to sentiment indicators.
Each Friday, holiday schedule permitting, the CFTC releases this information at 3:30 p.m. Eastern Time. Each Friday’s report contains data that is gathered the preceding Tuesday, so there is a bit of a lag in the reporting.
Since this information is used to find big turning points, and because sentiment indicators are often blunt-end tools as opposed to sharp-end instruments for timing markets, the lag usually isn’t a problem.
Specifically, the information contained in the report can be used to help guide traders to areas of the market where large moves may be about to occur due to an excessive buildup in sentiment in one direction.
You can find a full explanation of the CFTC’s methodology in gathering and reporting this information by visiting this link.
The Friday CoT report measures the long vs. short futures positioning of three different groups of traders in its simplest form.
First, the Large Speculators can be thought of as hedge funds and CTAs (Commodity Trading Advisors). This category of traders is viewed as trend followers.
Next, there are the Small Speculators, folks like you and me (i.e., retail traders). This group is also viewed as trend followers.
Lastly, there are Commercial Hedgers. These traders are swap dealers and producers that may be producing a commodity and are in the market to hedge their costs. This category is considered to be the “pros.”
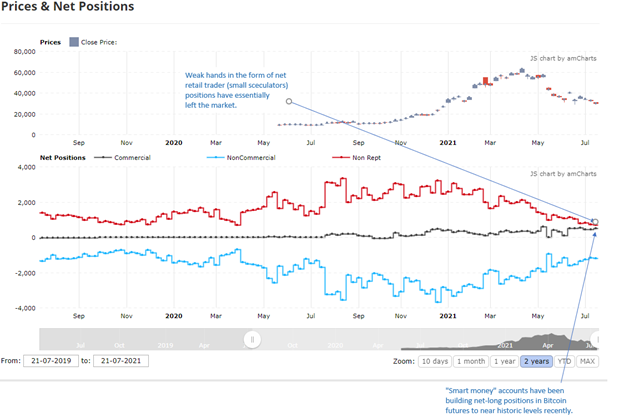
On the chart below, you can see how this report could have been used to identify a buildup to near historic net-long positions by “smart money” accounts (i.e., Commercial Hedgers) ahead of The B Word Conference.
In addition, the chart shows how weak hands, in the form of retail traders (small speculators) have essentially left the market, suggesting that there’s nearly no one left to sell long futures positions in this group.
Remember, the CoT report is a weekly report, so everything you see on this chart is weekly increments. Note: the following chart is from www.tradingster.com, with my annotations added.
Figure 1
Although hindsight is always 20/20, as the July crypto lows were forming the sentiment information shown above, when combined with the positive momentum divergences seen at July lows (see charts below) would have been useful enough to any traders looking to build countertrend positions in the crypto space.
Where do Bitcoin and Ethereum stand technically?
The bullish energy released by the 07/21 conference could not have come at a better time, since Bitcoin and shares of many crypto-related companies had been trading near multi-month lows prior to the event.
Figure 2
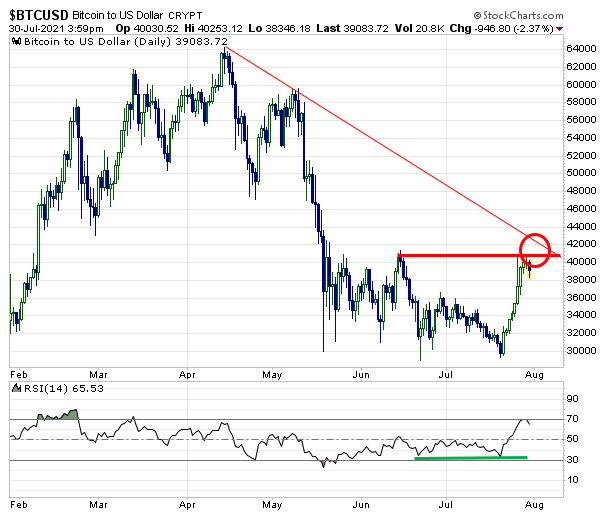
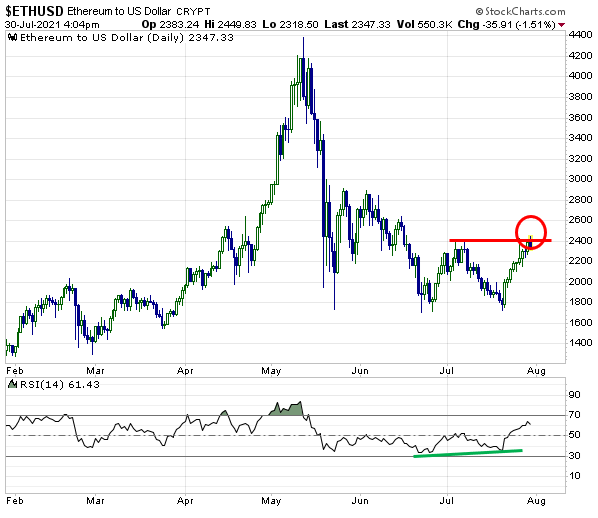
Figure 3
Bottom Line
While the higher trends that have developed since then in both Bitcoin and Ethereum have helped to put a floor in this market, that floor is still considered to be temporary as the prevailing downtrends have yet to be reversed.
For a reversal to occur, Bitcoin needs to generate weekly closes above the massive resistance confluence that still exists between 40K and 42K, and Ethereum must generate a weekly close above 24K.
By the way, a weekly close is not “required,” it is simply desired because it is considered a time filter that helps lend credibility to the signal.


1 Comments
Thank you Jason for this insightful write up. Your comments are timely to make informed decision.