

January Effect stocks like BBBY, ANGI, FUBO, VERI, and IQ are likely to benefit from Tuesday morning’s big jump in U.S. stock futures. As inflation cools and Fed policy shirts, it’s like the IWM, SPY, and QQQ follow the DIA from bear to bull markets. And I think they go in that order. FUBO is my favorite because of their fast growth and IQ might have gotten away, rallying quite a bit in December as China lockdowns eased. January effect stocks are better multi-week holds in anticipation of institutional buying across the month ahead of what could be a big year for stocks.
Momentum stocks SMMT, PHVS, and AMAM continue to trade nicely. SMMT finally saw some selling into last week’s breakout so we’ll need to see if the rising trendline at $4 holds for another setup. PHVS has been hovering just shy of the $12 resistance and I think it lands in the $15’s if this keeps up. AMAM had a monster spike on Friday, no doubt due to the swelling of short interest after that 1,000%+ 1-day rally. I continue to monitor all recent spikers for Fibonacci retracement swings.
ORIC is my favorite swing setup and if you look at the weekly chart you’ll see why. Range is to $7, initially, but I think it’ll climb to $10 after the recent good news it had. It’s in play above $5-$5.50 and one I’ve been talking about for a week. Cash need is low here with 33.1 months of cash left based on a quarterly cash burn of -$19.94M and estimated current cash of $220.2M. One thought I have is Pfizer may eventually just scoop the entire company.
SOUN made a monster move Friday but I refrained from putting it on the MondayMovers list because their cash need is high. The company has 1 month of cash left based on a quarterly cash burn of -$24.54M and estimated current cash of $8M. Since there was no news driving it Friday, I thought they might be running it up into dilution. This morning it’s up 14% on a gap so I guess I thought wrong, for now. I liked the pattern Friday and still do, so if it holds $2, I think $3-$4 is possible. My big concern here is I’m pretty confident we see an offering, so despite loving the pattern, the risk seems too high.
VATE has 7 months of cash left based on a quarterly cash burn of -$7.65M and estimated current cash of $17.7M leaving the overall risk of dilution low. Friday’s bullish engulfing candle leads me to believe it could trend between $$2.50-$3. Stop loss is below $1.50 from here as that should act as a base trade if this is to work. It’s possible the upside range has been chewed up here but so long as it’s above $1.50’s I’ll monitor.
NBY jumped 40% on Friday but I don’t trust this one. They recently did a reverse stock split so 1 for 35, have a history of high dilution, and given their overall cash need is high i.e. 3.2 months of cash left based on a quarterly cash burn of -$1.82M and estimated current cash of $1.9M, an offering is likely coming soon. SRGA is another that looked good Friday but has a high cash need and history of diluting often. Whether day or swing trading, you need to watch out for these pump and dumps.
HOTH, LANV, and KALA are 3 breakouts I’m watching. HOTH is my favorite because their cash need is low based on 25.7 months of runway on a quarterly burn of -$2.25 and estimated current cash of $19.3M. I’m using Fibonacci retracement here and thinking if it holds $7’s, it’ll test $12’s again. LANV is a bigger small cap but if it takes out $10, there’s blue sky above. KALA has been the strongest but if I’m the company I build my war chest into this move, so be careful of dilution, even though $25M came with their last round of favorable news.
GFAI is up about 50% this morning and I’m monitoring this cash flow positive security and protection services company closely. It was a big spiker last spring and if it holds near $.20, there’s a big upside range to $.40.
Too many stocks to talk about this week in just one watchlist. Join Lightning Alerts to get my nightly and daily watchlists as well.
Trading is a very emotional pursuit. I strongly recommend reading Trading In The Zone and The Disciplined Trader to help think objectively about your trades. Both books are by Mark Douglas and come with my highest book recommendation I could give you.
I recently created a trading plan checklist and how to video. If you recall, this is what helped me identify SMMT around $1 before it doubled into the $4’s within a week, PHVS in the $3.50’s before it ran to the $11’s same day, and who can forget AMAM at $.56 before it ran 1,007% the same day. Feel free to download the PDF and use it as a guide.
The Lightning Alerts live stream chat room schedule is 7-11A ET and 2-5P ET daily. The main topic centers around day trading.
- 7-9A ET Daily Strike
- 9:30-10A ET Gap and Go
- 10-11A ET Swing Trading
- 2-4P ET Swing Trading
- 4-5P ET Moon Shots
The newsletter schedule is 8P ET nightly, 12P ET daily, and 2P ET Friday (Monday Movers). The main topic centers around swing trading.
Day trades are alerted in the live streaming chat room. The goal on all day trades is 10-20% unless otherwise noted. Stop losses are based on technical analysis. The premarket scanner, powered by Scanz, sorts stocks under $20, up 2-10% (middle column) and 10%+ (right column). The 10%+ stocks are the Daily Strike candidates. Both columns start the 4A ET session at a $200,000 liquidity filter and switch to $1,000,000 at the open.
PRO TIP: Here’s the checklist I use to find these monsters:
- Amazing news (filter out puffery)
- Big range (50-100% to major resistance)
- Float (smaller = could run faster through range)
- Short interest (higher = turbocharged breakout)
- Dilution risk (must be medium to low)
- Entry (am I chasing)
- Take the trade
Swing trades are alerted in the live streaming chat room, RagingBull APP, and email in that order. The chat room and APP alert delivers instantly and at the same time. The email alert is slower to arrive. For swing trades, I buy after subscribers have been alerted. This means once the email lands in my inbox, I look to buy or sell. For you to receive a swing trade alert from me, a trade plan must have been discussed in the newsletter first. The goal on all swing trades is 10-20% unless otherwise noted. Stop losses are based on technical analysis. 🧐
Long-term trades are alerted by email before I buy. For you to receive a long-term trade alert from me, a trade plan must have been discussed in the newsletter first. The goal of long-term trades is 50%+ unless otherwise noted.
Here are 25 terms you should know. Please let me know in chat if I’m missing anything or you have clarifying questions.
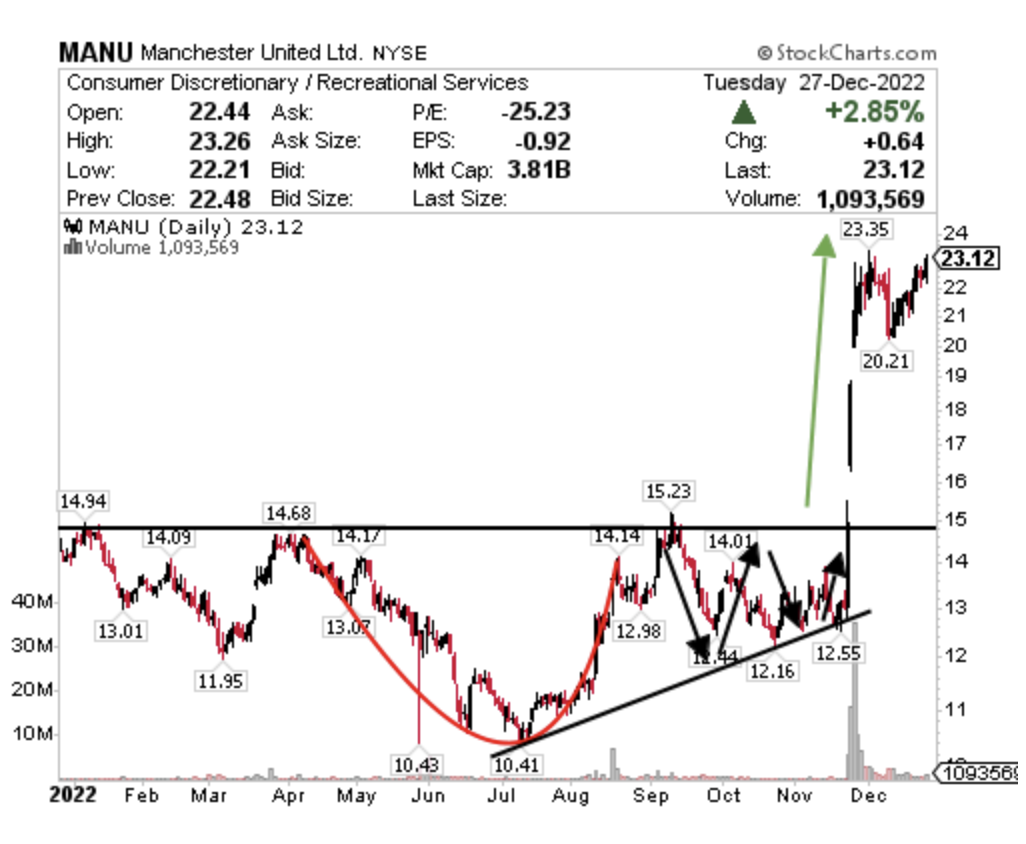
Stocks tend to move in 3 patterns. The way I visualize this is in breakdowns (fishhook), continuation patterns (bull flag / pennant), and breakouts (rocket). This chart on MANU is a good visual of how I see the market i.e. fish hook (red), pennant (black), and rocket (green). Breakdowns and breakouts are my favorite because they present the most volatility and range in both directions.
Fishhook a.k.a. Breakdown chart pattern. The fishhook pattern emerges on a sharp downward move in the stock price through support on heavy volume and tends to be quick in duration and severe in magnitude. Excellent for Swing Alerts.
Pennant a.k.a. Continuation chart pattern. A pennant will have a period of consolidation inside the triangular flag shape on lower volume followed by a breakout, outside the triangular pattern, on higher volume. Excellent for Swing Alerts.
Rocket a.k.a. Breakout chart pattern. A rocket is when the stock price moves outside a defined support and resistance level with increased volume. Enter long on a break above resistance or short on a break below support. In penny stocks, breakouts are often accompanied by dilution which for the most part, destroys the momentum. I use Dilution Tracker to gauge offering risk. Excellent for Lightning Alerts.
To better understand day and swing trading chart patterns I recommend The Candlestick Course.
It is not wise to try and mirror my trades. And it’s especially unwise to chase trades. There is nothing wrong with us being in the same trades but remember, I am not a financial advisor, my results aren’t typical, I likely have more experience than most, and my tolerance for risk is high. Instead of mirroring I’d like you to learn from what I’m doing and create your own trade plan. Trading is hard and most traders lose money. Those willing to work at their trading are most likely to get better at trading. Those looking to get rich quickly will likely blow up their accounts. I had a good year in 2021 and a bad year in 2022. In an effort to be as transparent as possible, whether I have a good or bad year in 2023, I am committed to live streaming my open day, swing, and long-term positions during the day and publishing my statements at the end of each month for all to see. I hope to have a very, very good year. I hope you have one too.

