
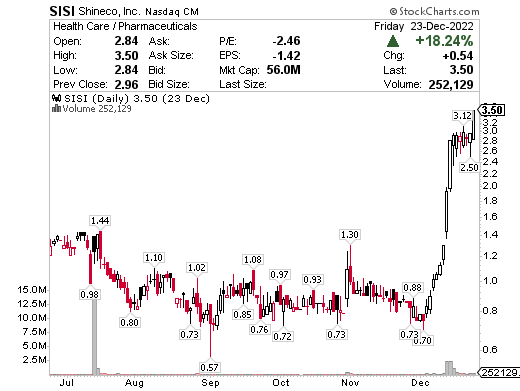
SISI is in breakout mode and I like it to $5. The company has 32.4 months of cash left based on quarterly cash burn of -$2.11M and estimated current cash of $22.8M. With low risk of an offering, the base trade is above low $3’s, exit in the $4’s. Goal is always 10-20% in 1-4 days if entered.
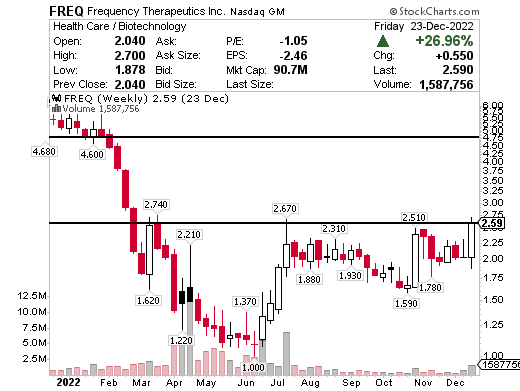
FREQ has a strong ascending triangle and breakout range to $5 if this opens up. The company has 18.4 months of cash left based on quarterly cash burn of -$14.21M and estimated current cash of $87.2M. I chose the weekly 1-year chart as it best represents what I see unfolding here. Certainly one of my favorites to watch this week.
ORIC was a monster from Friday’s Lightning Alerts watchlist which said, “ORIC had good news with Pfizer and already had a low cash need. The company has 33.5 months of cash left based on quarterly cash burn of -$19.94M and estimated current cash of $222.6M. I believe we’re looking at a breakaway gap to $7’s on this one. The weekly 2-year chart best illustrates the range on this one. If that long base it’s been in breaks, it should open up.”
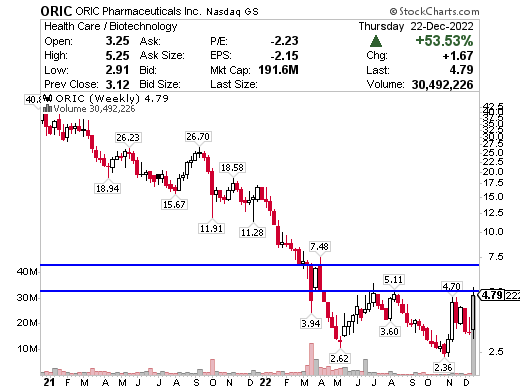
This one had all the reasons to keep going up Friday. Notice how the weekly chart above looks just like the FREQ weekly chart?
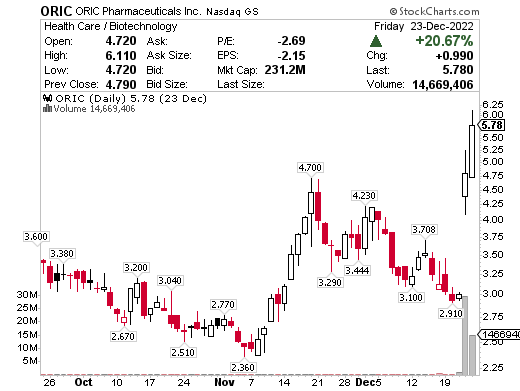
It’s still in play but the ‘easy’ trade, if there is such a thing, was entering Friday on that $4.70 breakout. Overall just a great lesson in why stocks go up and what to look for both fundamentally and technically.
Moving right along.
NOTV is a fish hook I’m watching i.e. oversold chart pattern. It showed the start of a bounce Thursday and Friday so as long as it holds upper $4’s, watch for gap recovery and a move to $8. The cash need is low here but historically they raise the outstanding shares often and have the ability to do so again with a shelf or S-1. The company has 30.2 months of cash left based on quarterly cash burn of -$1.8M and estimated current cash of $18.1M.
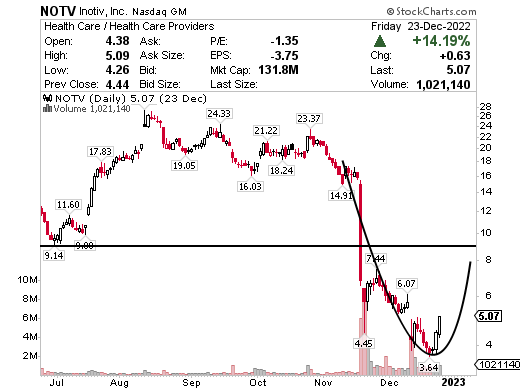
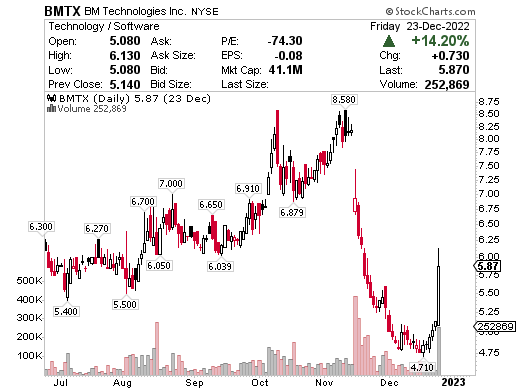
BMTX, which is cash flow positive based on quarterly operating cash flow of $2.48M, and just ripped from $5-$6 in a fish hook, is a good example of what I think could happen to NOTV soon.
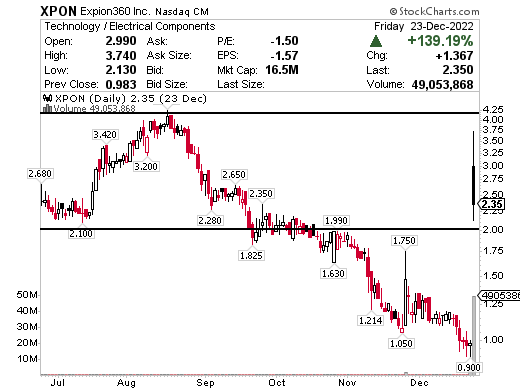
XPON was a monster Friday and I really like it to continue this week. The company announced an exclusive lithium battery supply deal triggering a 139% move higher. The company has 12.6 months of cash left based on quarterly cash burn of -$1.57M and estimated current cash of $6.6M. So low risk of an offering here according to Dilution Tracker. In the absence of an offering I’ll watch $2 support for a base trade and see if it revisits $4’s.
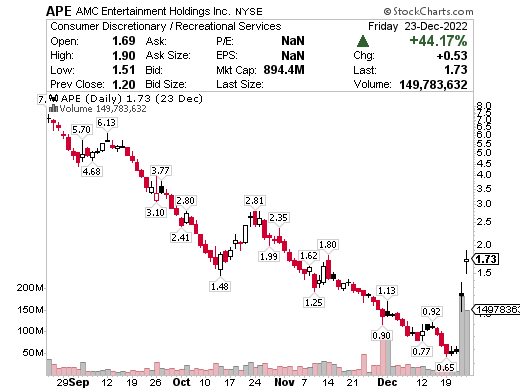
APE had an impressive end to last week and actually broke long-term trendline resistance. This is a very bullish move but I question if it can keep up. The company has 11.0 months of cash left based on quarterly cash burn of -$198.4M and estimated current cash of $726.0M. The volume is impressive but unlikely to last. That said, strong is strong so if it holds $1.50, it’s in play for a move to the middle $2’s, maybe $3.
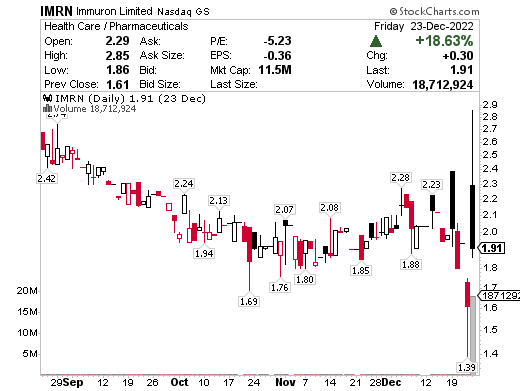
IMRN is one to watch headed into 2023. The company has 77.2 months of cash left based on quarterly cash burn of -$0.61M and estimated current cash of $15.7M i.e. low risk of an offering. It tried to breakout Friday on good news and was very active in the premarket, however, shortly after the open it gave up trying for $3’s and settled under $2. If it holds $1.80, I believe this might actually make a run at $3 soon. It’s a messy chart, I get it, but the news was good so if they lay off the selling, it should get going.
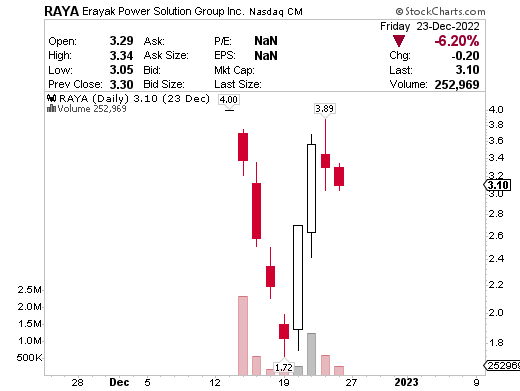
RAYA did their IPO on the same day as Powell raised rates a few weeks ago, so horrible timing and came down with the penny stock 2000. It then whipsawed right back to $4. If this takes out $3.75 and holds, I’d look for a $1-2 delayed IPO spike. Tiny company and there doesn’t seem to be a lot of sellers, yet.
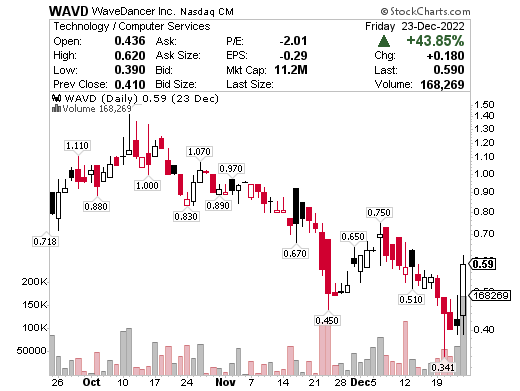
WAVD buyer beware. Shares popped 44% Friday but they are out of cash. Their offering ability (shelf or S-1) is low but their cash need is high. The company has -0.3 months of cash left based on quarterly cash burn of -$1.7M and estimated current cash of $-0.1M.
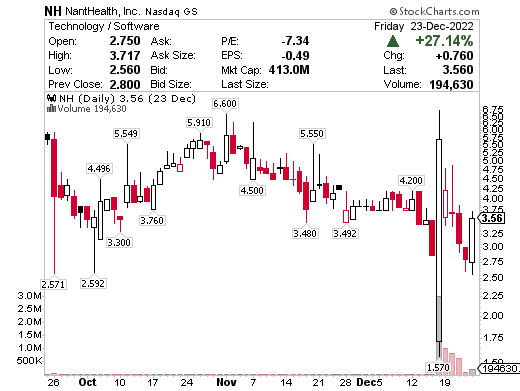
NH is another runner from Friday I think is going to dilute so don’t be fooled by the pop. The company has -2.7 months of cash left based on quarterly cash burn of -$8.41M and estimated current cash of -$7.6M. They reverse split the stock 1 for 15, which is common just before an offering.
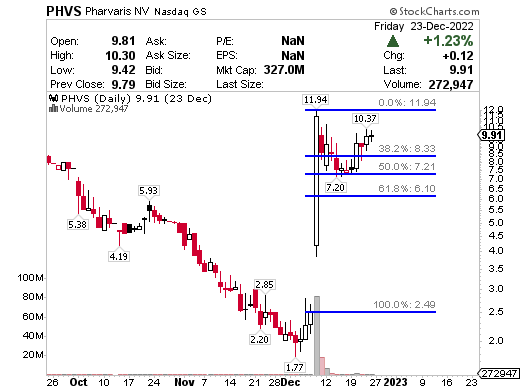
PHVS is one of my favorite Fibonacci setups. The company has 38.1 months of cash left based on quarterly cash burn of -$14.34M and estimated current cash of $182.3M. Range here is to $15 I think so if it tests $12, watch for that breakout.
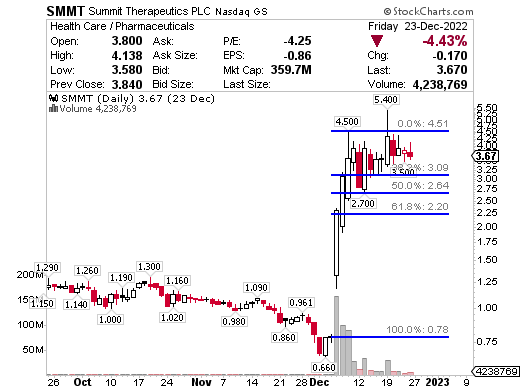
SMMT landed a monster deal recently and it’s been super strong since. Shorts are looking for an offering here and while price action would suggest they aren’t going to get it, there is medium risk according to Dilution Tracker. The company has 20.5 months of cash left based on quarterly cash burn of -$15.59M and estimated current cash of $106.7M. So long as the Fibonacci retracement continues to hold, I lean bullish for $5-$6 on another breakout higher.
AMAM is another Fibonacci retracement stock I continue to watch and I like that they don’t dilute often. The company has 13.4 months of cash left based on quarterly cash burn of -$20.1M and estimated current cash of $89.5M. This week I’m looking for a move from $1.50 to the middle $2’s.
Lightning Alerts! WHY, HOW, WHAT
WHY my subscribers like Lightning Alerts:

My nightly newsletter explains the swing trade alerts you’ll receive the following day.
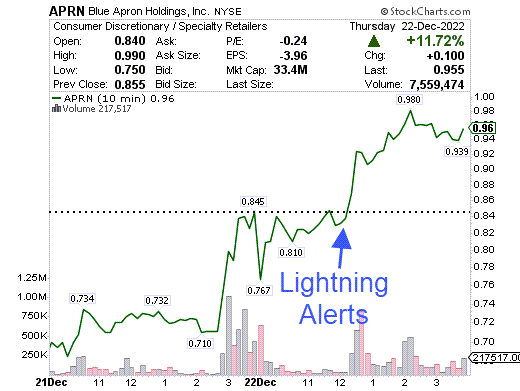
For example, Wednesday night APRN was on the watch list. Here’s what that said.
“…this is a dead cat bounce opportunity. Shorts are right on this one but it’s so obvious, there is nobody left to sell. If it crosses $.84 look for $1-$1.20.”
HOW my subscribers use Lightning Alerts:
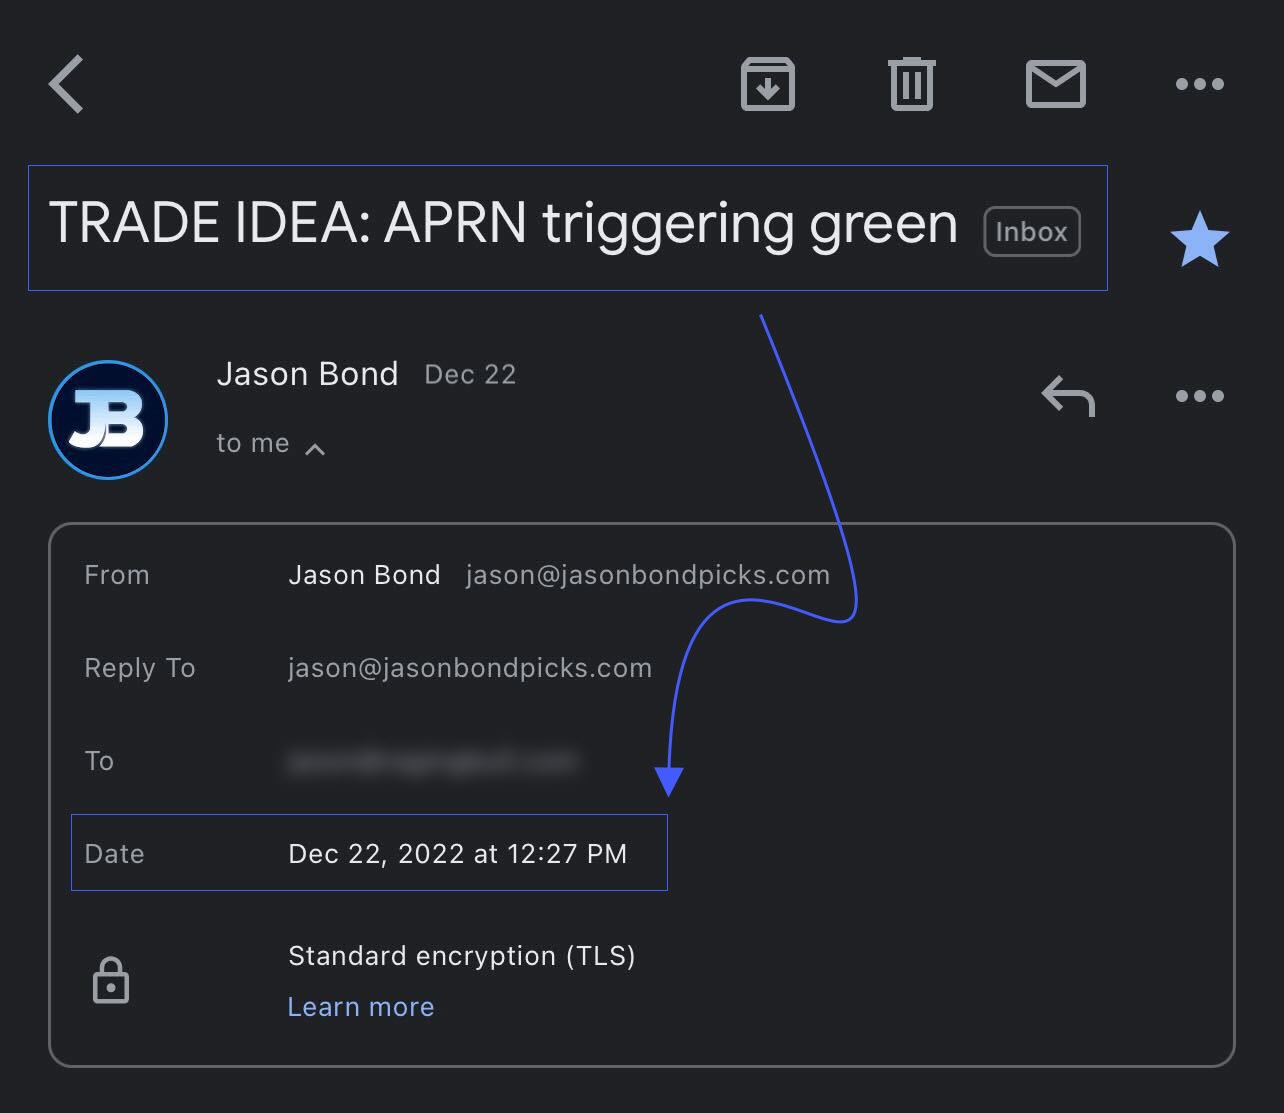
Now that you know what to expect, I fire off real-time trade alerts to your smartphone (like a text) and email during market hours.
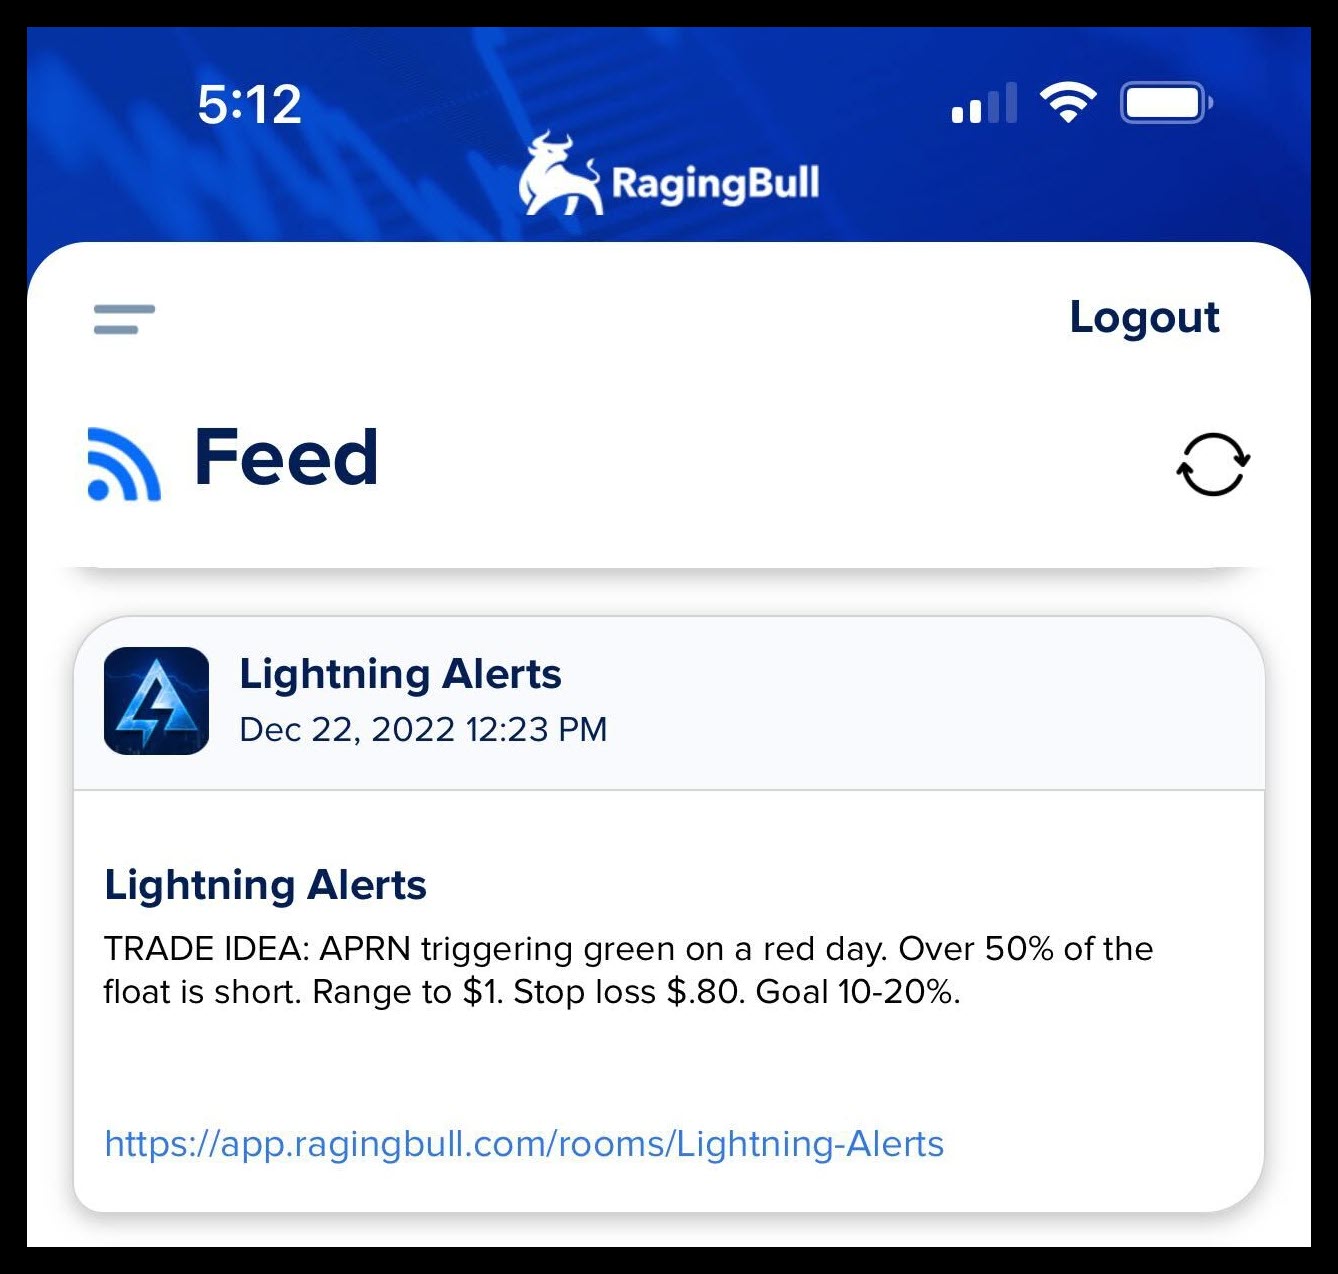
WHAT my subscribers see in Lightning Alerts:

Timely education matters. The time stamp on the ‘text message’ seen above is 12:23 PM ET.
This is what subscribers saw Thursday.
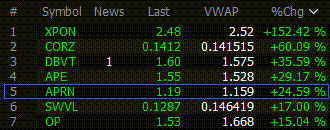
Here it was Friday morning. There were 7 stocks up 10% or more as I typed, with $ liquidity.
$.84-$1.19 = 42%
Not all trades are winners of course, but this is what it looks like when they do win.
I created Lightning Alerts to teach traders in real-time:
- WHY penny stocks might make a big move
- HOW penny stocks make that move
- WHAT it looks like when they do move
If you’d like to be a subscriber of Lightning Alerts with thousands of others, we’d love for you to join us.
Apply Coupon Code: SAVE100