

In my opinion, I think the market volatility is starting to slow down.
And if my guess is good, then the bounce is just starting…and we’re going to see some more j-hooks in the coming weeks.
Before I go into any details of the trade, I’d like to talk about this setup.
It’s one of my favorite patterns — I call it the J-hook. It’s something I’ve relied on heavily in the last decade and it’s still effective.
This pattern can work on day trades, but I like to use it when swing trading (over the course of a few days or weeks).
Here’s how it works:
I like to explain this pattern with a knife cut analogy.
Think of it as a fresh cut on your finger — at the start, there’s profuse bleeding.
The result?
Overreaction. You get caught off-guard and start panicking.
Shortly after…the bleeding stops, you put on a bandage, and things start getting better.
The Fish-Hook or J-hook pattern occurs when a large wave of emotional panic selling drives a stock very far into the oversold territory.
Again, emotion is what drives the price action most of the time.
Eventually, sellers dry up, at which point buyers and short covers get to work allowing for a quick upside.
Please note: this works best if there’s a 50% drop in the stock in under one month.
Here’s a chart with a clear example of this pattern:
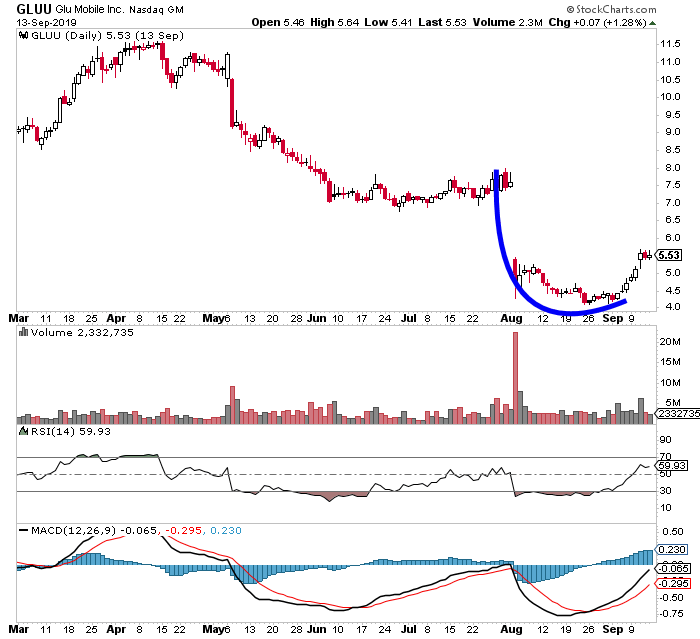
It requires a market that has horrible news. You just have to wait for the panic (bleeding) to subside and then it gets better.
The up move may only be a fraction of the preceding down move, yet the move may be sizable if entered correctly.
You can see, the anticipated move (marked with blue) looks quite literally like a Fish Hook. A patient and timed entry can give you a very clean and limited risk.
What happened with Facebook:
On Sunday (as usual), I highlighted FB on the Weekly Watchlist.
And from the look of things, all the boxes were being checked for J-Hook. Based on it’s RSI (Relative Strength Index), it was clearly oversold.
For those who aren’t sure, RSI is a way traders use to study the price movement of a stock. The whole point is to measure how quickly other traders are bidding the price of the security — either up or down.
The RSI chart is usually placed below the price chart for the stock (just like I did below). This allows me to compare its recent momentum against its market price.
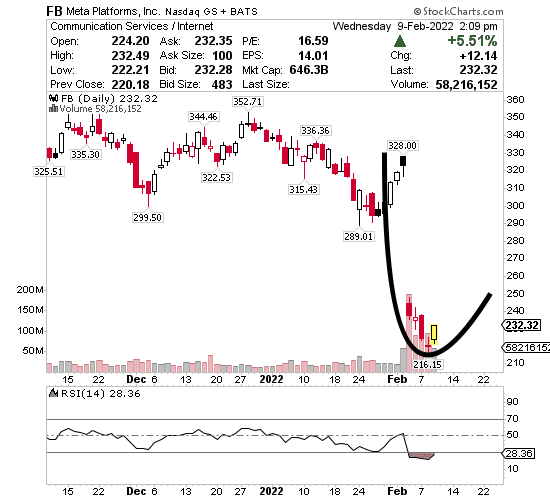
Most traders interpret RSI readings below 30.00 as a solid sign of oversold conditions. From the chart above, you could see it was clearly below the 30.0 mark.
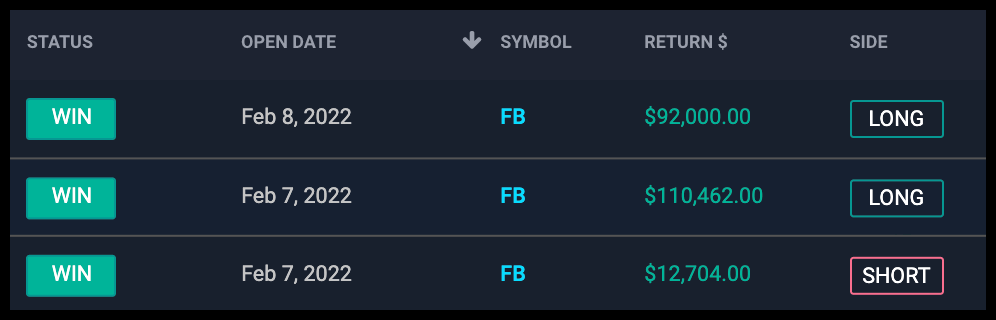
I pulled the trigger and if you look through my trading journal here (where all of my open and closed trades and other details of each trade can be found)…
I think we can both agree it turned out well.
In my opinion, that’s the most oversold I’ve ever seen on Facebook.
And my guess is I probably won’t get that opportunity again for a long, long, time. Which to me is a pretty good sign of a bottom.
This is clearly a dead cat bounce as this recovery is temporary and short-lived — the overall downtrend continues. That being said, I see an opportunity as it dipped after this short recovery so I’m back in again and we’ll see how it goes.
You can look at my trading journal here to keep track of how it turns out.
If you’d like to learn more about the J-Hook pattern and see actual examples…


