

Look, not every trade idea plays out in the manner we hope it will.
For instance, Pixelworks Inc.(PXLW) from the Weekly Watchlist has been at the top of my list as a stock to keep an eye on recently.
Originally I liked it for the protection the technical setup was offering earlier this week.
While I still like the setup, key support is really being put to the test as we get ready for the start of a new week.
Even the most seasoned traders are never through learning from the market.
That’s why, today, I want to walk you through what I still like about this stock, while at the same time highlighting some of the recent developments that have me exercising some caution.
Smallish floats provide great fuel for big moves
Pixelworks Inc. designs, develops, and markets semiconductors and software that enable the visual display of broadband content through a wide variety of electronic devices.
While only 5% of the available float is short at this time, the float itself, which according to Finviz stands at 48M shares, is on the small side, which means that if the stock happened to catch a strong bid, it could get to the point where traders and investors would need to fight it out to be able to acquire shares as higher prices started to develop.
Add in the fact that only 29% of the available shares are owned by institutions and you’ve got added fuel for a rally in the event any large institutional players want to acquire available shares.
Teachable moment:
A stock float is the total number of shares that are available for public investors to trade in (buy and sell). The number is often shown as an absolute figure such as 10 million shares, but it can sometimes be shown as a %age of the company’s total outstanding shares.
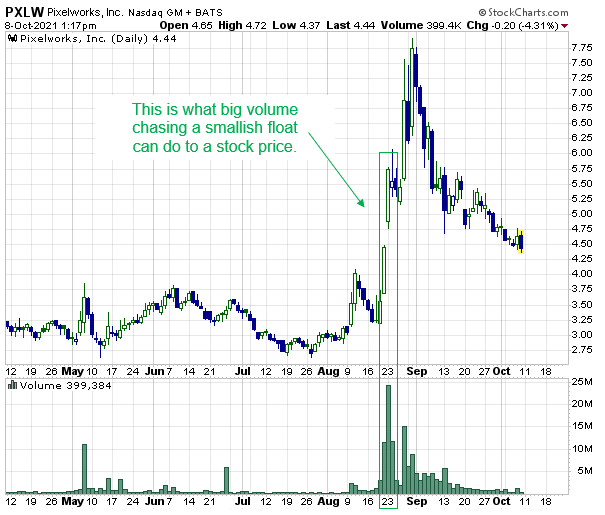
A great example of what can happen when panic buying in a low float stock occurs can be seen in Figure 1, where 3 straight days of 10M+ shares traded caused this stock to surge.
Figure 1
There is no shortage of support for Pixelworks Inc. share
Figure 2 shows the big support area that this stock is now testing, making me quite interested in the possibility of entering a long position.
Figure 2
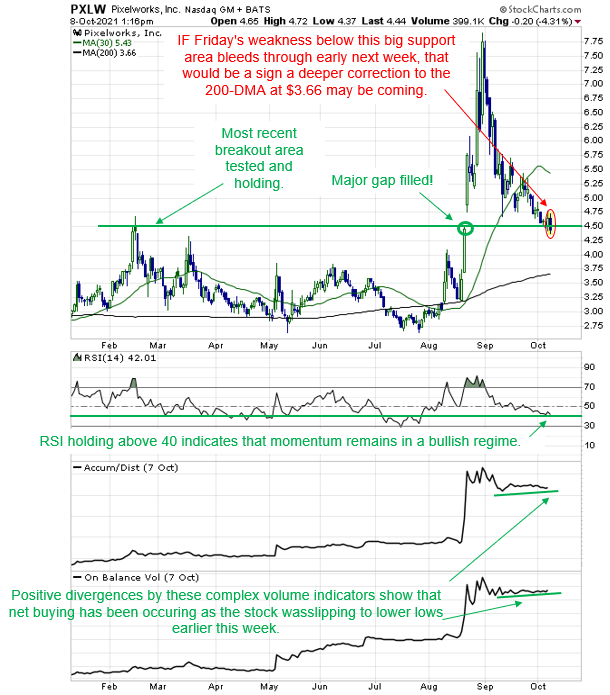
Specifically, the combination of gap, Fibonacci, and former breakout support, all in the $4.60/$4.45 area.
First, according to Stockcharts.com, “Gaps result from extraordinary buying or selling interest developing while the market is closed. For example, if an earnings report with unexpectedly high earnings comes out after the market has closed for the day, a lot of buying interest will be generated overnight, resulting in an imbalance between supply and demand. When the market opens the next morning, the price of the stock rises in response to the increased demand from buyers. If the price of the stock remains above the previous day’s high throughout the day, then an up gap is formed.
Gaps can offer evidence that something important has happened to the fundamentals or the psychology of the crowd that accompanies this market movement.”
As Figure 2 shows, a major gap at $4.45 was filled and held late this past week, satisfying an old Wall Street adage that says, “Eventually, all gaps get filled.”
Next, an important 61.8% Fibonacci retracement of the entire July 27th through August 31st high was completed this past week.
Also, the breakout area where shares of PXLW exploded above the mid-February price highs on August 20th is now being tested.
Finally, and secondary to the price action just presented, both momentum and volume have been showing bullish signals in recent days.
Specifically, starting with momentum, the default 14-day RSI indicator held above the 40 level this past week.
Teachable moment:
RSI is a trend strength indicator as much as it is an overbought/oversold indicator, and when RSI bottoms above the 40 level (the bottom of its bullish range) during a downside price correction it is a sign that the long-term trend strength is healthy.
Next, in the two studies (On Balance Volume and the Accumulation Distribution Line) at the bottom of Figure 2 above, there has been net buying as the stock was making new lows earlier this week.
In short, there is ample support for this stock to grasp onto.
While there was a bid at this support confluence this past Thursday, unfortunately, there was not enough follow-through buying interest to keep the stock above this support into the week’s close.
There is a saying on Wall Street that says, “One day does not a breakdown make.”
This means that it typically takes more than a one-day break below a major support zone to signal that a major breakdown has occurred.
The lesson that traders should take from this is that if they were one of the many traders that bought shares of PXLW earlier this week in anticipation of this big support area generating a bounce, Friday’s one-day close below this area may not be enough to stop out of those positions.
If the weakness carries through to next week, however, then that’s a different story.
Specifically, if Friday’s weakness below this big support area bleeds through early next week, that would be a sign of a deeper correction to the 200-DMA at $3.66 may be coming.


2 Comments
Very vital analysis.
Interested