

This past Tuesday, after the market close, Microsoft (MSFT) announced that its board approved a new share repurchase program authorizing up to $60 billion in share repurchases, which is shaping up to be a record for the company.
The new share repurchase program represents 2.7% of MSFT’s entire market cap and comes exactly two years after the company’s last buyback authorization which was $40 billion.
Today, I am going to show you why stock buyback announcements can often generate an initial upside price response, and I’ll show you how MSFT’s chart setup prior to the announcement acted as an ideal springboard to propel the stock higher.
What is a share buyback?
When a company wants to reward its shareholders by returning value, a very common method used is to buy back its own shares.
Also known as a share repurchase program, share buybacks occur when a company purchases its own shares in the open market.
Here’s how a stock buyback can affect a stock’s price
When a company buys back its own shares it results in a reduction in the number of tradable shares, which increases the ownership stake of each remaining shareholder and, ideally, the price of the stock.
Retail traders also find buybacks desirable because they can be more lucrative to shareholders if the company’s stock is undervalued when buyback occurs.
Therefore, it’s important for the buyback to occur when shares are not considered to be overvalued, as this can be viewed negatively by the market.
Initially, if the market believes the company got a good deal for its money, the stock price will often rise because shareholders know that a buyback will immediately boost earnings per share.
Over the long term, though, the effect that the repurchase program has on the share price depends on whether shareholders believe the company paid a price that was lower than the stock’s intrinsic value.
This week’s MSFT share buyback announcement came right after a bullish chart development
As a trader, the announcement of a share buyback should always peak your interest.
Why?
Because, if these announcements occur when the stock price is sitting with a bullish chart setup, it can often produce a lasting bullish reaction.
As Figure 1 shows, this was the case with MSFT this past week.
Here’s what I mean.
Figure 1 below shows that, on the day prior to the announced share buyback, shares of MSFT formed a bullish “doji” candle formation at a confluence of powerful support from the rising 34-day moving average (a Fibonacci number that I like to track) and the bottom of the 08/19 – 08/20 gap.
Figure 1
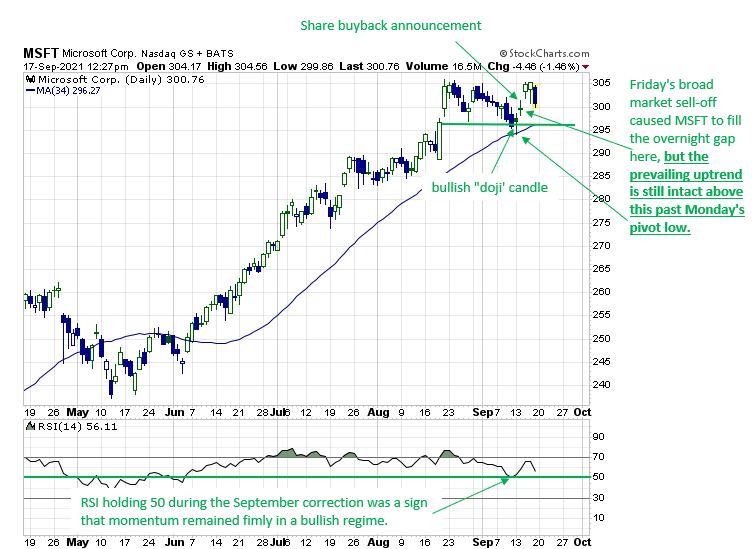
In addition to the big area of price support and the bullish candle pattern that formed in the $296 area prior to the buyback announcement, 14-day RSI (see bottom panel of Figure 1) was showing that, during the early September price correction, momentum had remained firmly within a bullish regime.
While some sophisticated traders often use a combination of historical tendencies and accounting methods to speculate that a company may be about to announce a share buyback program, to be able to time such announcements with precision is nearly impossible.
Despite not being able to time such announcements, traders must always remain on the lookout for potential catalysts such as this, since they can often produce sustained rallies when market conditions are technically healthy.
In this example, after the initial buying response to this past Tuesday’s buyback news caused shares of MSFT to test their all-time highs, broader market conditions really began to sour on Friday, causing the stock to fill the gap left by this past Tuesday’s overnight announcement.
But having a recent catalyst such as this occurring right above a big major area of support is essential to defining our trade risk.
In other words, the $296.80 to $294.08 area where this past Monday’s bullish “doji” reversal occurred is now the area that defines a bullish trader’s downside risk.
Why?
Because, without question, any decline in the share price back below that level would signal that the current uptrend has broken down.
As long as the broader market does not fall apart, this is a technical setup that should continue to favor bullish trades.


1 Comments
It’s a shame you don’t have a donate button! I’d definitely donate to this brilliant blog!
I guess for now i’ll settle for book-marking and adding your RSS feed to my Google account.
I look forward to new updates and will talk about this site with
my Facebook group. Chat soon!