
Markets witnessed a sharp increase in volatility this past week, with the CBOE Volatility Index rising from nearly 1.5-year lows the prior week to a 2.5-week high this past Thursday.
One day after the benchmark S&P 500 touched yet another record high on Wednesday, investors began to show some valid concern over two issues with the potential to trigger an economic slowdown later this year:
- The Delta variant of COVID-19.
- A possible move by the Federal Reserve to taper its bond purchases before year-end.
As traders, we must learn to recognize when market conditions put our favorite strategies at risk.
That process can either include shutting down trading altogether and spending that extra time with friends and family, or it can include the adoption of new strategies that will benefit from market turbulence.
That’s why I offer a number of different services that allow traders to follow both long and short ideas.
Given the weakness in small caps this past week, I took a step back from generating a lot of trading ideas in this sector.
I’m about to show you how to determine when the recent weakness in small caps may finally reverse to the point where confidence can be regained in this part of the market.
Trading opportunities come in all shapes and sizes
If you stopped by the Octagon Wednesday, preparing for weakness in small caps is something we discussed in the afternoon session.
IWM, which is the most widely followed ETF that tracks small caps, has been taking a beating of late, and that’s why there hasn’t been much trading being done in the Jason Bond Picks newsletter this past week.
At some point, small caps will come back into favor.
But when will that be?
While no one knows for sure, there are ways to look for tactical (short-term) trading opportunities until there is an official trend reversal that tells us small cap leadership is here to stay again.
Here’s what I mean.
On the chart directly below, I’m showing a relative strength ratio chart of the iShares Russell 2000 Small Cap ETF (IWM) divided by the SPDR S&P 500 ETF (SPY).
These ratio charts are the simplest form of quantitative analysis used by many professional money managers to identify areas of leadership within the market.
On the chart directly below you’ll notice that I’ve annotated that when the ratio line is rising, the asset in the numerator position (IWM) is outperforming, and when the ratio line is falling, the asset in the denominator position (SPY) is outperforming.
Figure 1
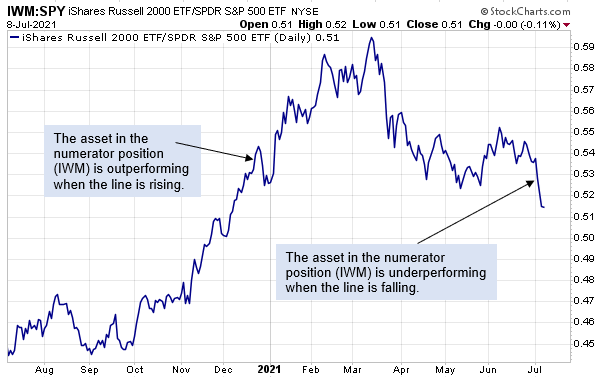
Therefore, when we look at the right side of the chart, we can clearly see that IWM has been underperforming rather aggressively in recent days.
But how can we determine when small caps might be ready to show some tradable leadership (i.e., a bounce back in favor of IWM), or gauge how strong this trend of underperformance is?
There are a number of tools at your disposal to help answer these questions.
Today, I am going to show you a combination of indicators that can be used to trade this ratio for short-term swings, and one very important indicator that is commonly used to determine the strength of a longer-term trend.
How to identify high conviction short-term trading opportunities
First, let’s look at the short-term.
On Figure 2 below, you’ll notice I’ve added a 3-Day RSI momentum indicator and Bollinger Bands to the ratio chart shown above.
Why did I change the default 14-Day RSI setting to 3 days?
Because, for the most part technical indicators can be adjusted to fit a trader’s timeframe needs.
For example, someone who is a position trader may hold positions for months at a time.
In this case, he or she might consider changing the default 20-day moving average setting for Bollinger Bands to 200-days, with the goal of identifying when a stock has moved too far away from the long-term 200-day average vs. the shorter-term signals provided by the 20-day average.
For our purposes today, we’re keeping the default 20-day moving average Bollinger Band setting but changing the default 14-Day RSI setting to 3 days in an attempt to identify a possible 1 to 5-day swing trade opportunity.
Figure 2
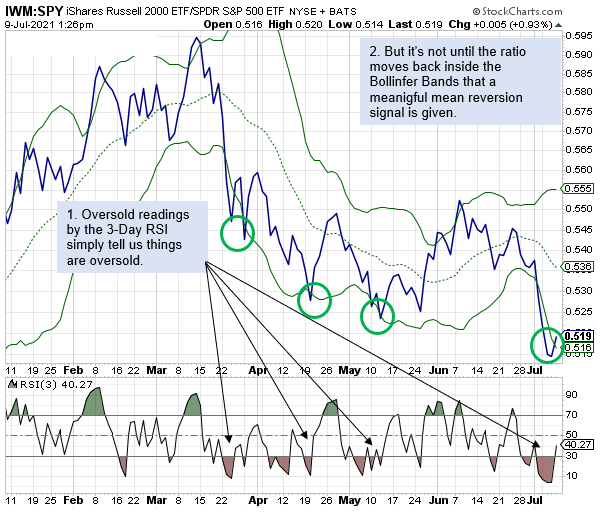
As the chart shows, using the 3-Day RSI to identify periods where IWM has become oversold vs. the benchmark S&P 500, then using Bollinger Band signals as the official entry signal has proven effective this year.
To clarify, a trader would only use the oversold 3-Day RSI as an indication that IWM has become oversold vs. the S&P 500.
The final decision to overweight small caps to the long side, however, is not be made until the ratio moves back inside the Bollinger Bands (see green circles), which is a statistical signal that price (in this case, the IWM / SPY ratio line) is poised to revert back up toward the 20-day moving average.
How to determine a long-term trend’s strength
To become a successful trader, you must learn to control your emotions.
Part of this learning process includes the ability to know when a trade has run its course.
For instance, if it turns out that the latest oversold rebound back in favor of IWM shown above ratio does in fact continue to rise back up to the 20-day moving average over the days ahead, right now the strength of the longer-term trend of IWM underperformance is so strong that a trader should not expect that rebound to continue beyond the 20-day moving average without further evidence.
Here’s what I mean.
There are just a few indicators with the sole purpose of determining a trend’s strength.
One of the most commonly used trend strength indicators is the Average Directional Index (ADX).
This is a rather complex indicator, the mechanics of which probably demand a more thorough review than the summary I am about to present.
The complete details of this indicator can be found here.
Simply put, the Average Directional Index is a trend indicator that measures the strength of the current trend, no matter the direction.
Average Directional Index shows you the trend direction by two associated indicators, the Negative Directional Indicator (-DI) and the Positive Directional Indicator (+DI).
First, you must calculate the Plus Directional Movement (+DM) and Minus Directional Movement (-DM) indicators as follows:
+DM = High – Previous High
-DM = Previous Low – Low
Again, this is a very simple explanation, and a more thorough review can be found here.
How to trade using the ADX indicator
First of all, you can find the ADX preinstalled in many platforms with basic settings. The default period will either be 10 of 14 days, depending on the platform you use.
In its most basic form, when the ADX line is seen rising above the 25 level, a strong trend is said to be in place.
Note: Some traders actually use the 20 level as their signal level. Like so many other indicators, it takes a lot of practice before a trader feels comfortable with the settings that make the most sense to their trading style.
When we apply the basic methodology to the IWM / SPY ratio line, shown on Figure 3 below, we see that the ADX indicator is just starting to rise above the 25 level.
Figure 3
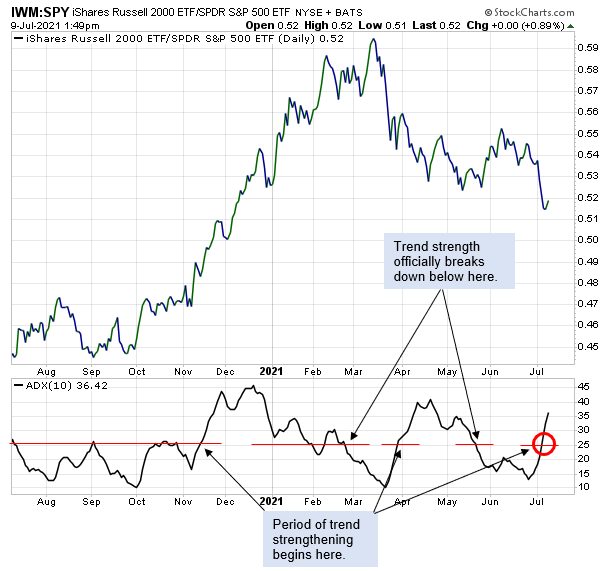
Again, as I mentioned earlier, this indicator is telling us that the current long-term trend of small cap underperformance is actually getting stronger (see red circle), and it’s going to take a good amount of time for this trend to show signs of slowing before the trading community can feel confident that small cap underperformance has ended for a while.
Bottom Line
By looking at both the short and long-term pictures, we’ve determined that while the IWM / SPY ratio’s move back inside the 20-day Bollinger Band this past Friday is signaling that small caps appear poised to outperform again, right now expectations should only be for this outperformance to develop as a short-term correction within a longer-term trend of underperformance.


1 Comments
Thanks for the info! KD