

It might be a shortened week in the stock market, but with the flurry of breaking news and upcoming events this week, it probably won’t be a dull one!

As a day trader, I like to be up to date regarding breaking news and events that might impact the stock market and overall trend.
Especially this year, it has so far proven to be critical.
Headlines surrounding inflation, interest rates, COVID19, the Russia Ukraine tensions, and more have had and might continue to impact the stock market and economy significantly.
Yesterday, Russian President Vladimir Putin ordered troops into pro-Russian regions of eastern Ukraine hours after he recognized the independence of the Moscow-backed regions.
For more on that and the latest on the Russia Ukraine crisis, click here.
That move by the Russian President seems to have further escalated the crisis in the region, with many countries now imposing sanctions on Russia.
With the possibility of a war beginning growing larger and the effect on the supply of certain goods and services, such as oil and gas, the market is currently and understandably spooked.
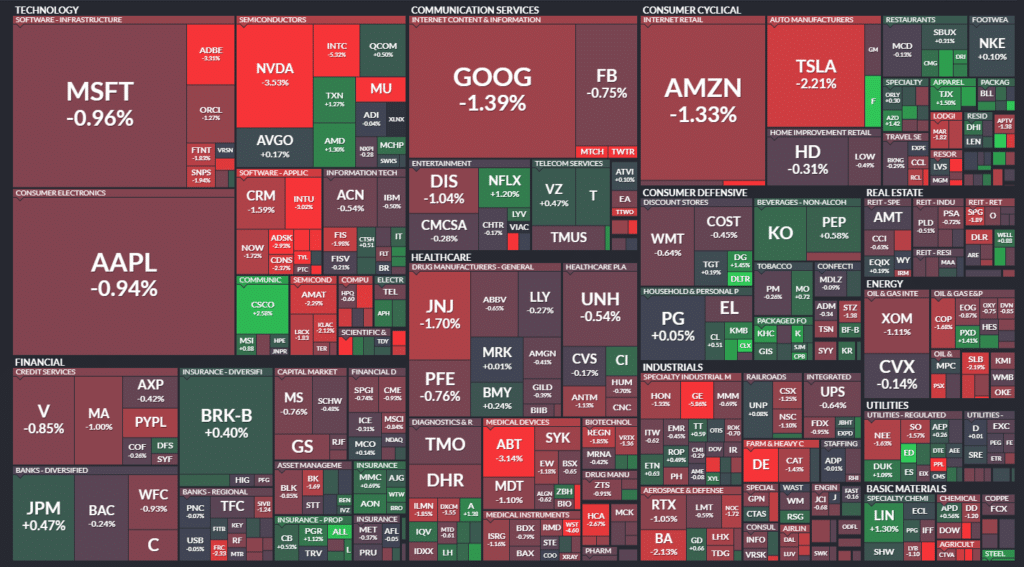
In the above map from Finviz, indicating the S&P500 stocks categorized by sectors and industries and sized by market cap, you can see that the selling pressure continued on Friday.
When writing this, the SPY was gapping lower in the pre-market.
So, gang, as I predominantly focus on small-caps and penny stocks, how does the overall market uncertainty and volatility impact my focus and game plans?
The Importance of Relative Strength
There’s an old saying in the markets, “Don’t try and catch a falling knife.”
That almost sums up what I am going to discuss below.
You see, gang, during periods of a downtrend or uncertainty and volatility in the market, I might look to play the direction in the overall market or stick to my traditional playbooks with penny stocks.
However, when I am looking at potentially going long a penny stock, I make sure that the stock shows relative strength and has one of my favorite setups.
So what is relative strength?
Simply put, relative strength is when you compare two or more stocks’ performance and identify the difference in strength between them.
For example:
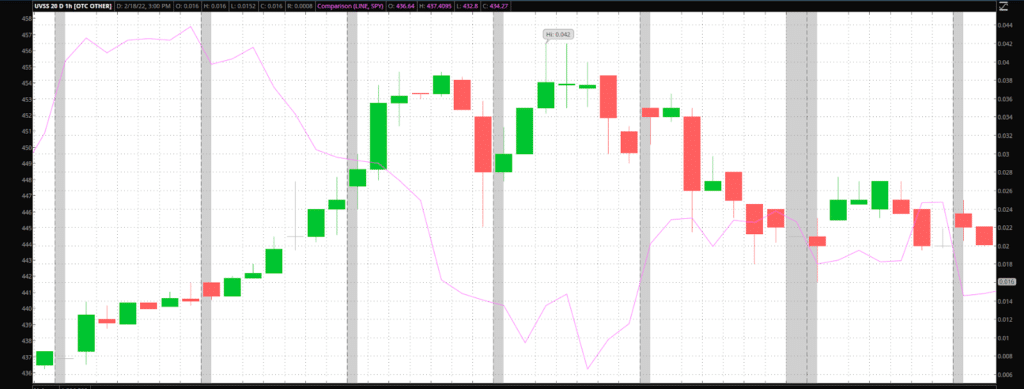
If you recall, last week, I did a trade recap for UVSS and went over the higher high higher low set up in the stock.
Well, let’s refer back to the chart of UVSS, from the period when I made the trade.
Except for this time, I will overlay the chart with SPY (pink line), courtesy of the thinkorswim platform.
In the above chart, you can see that when UVSS was trending higher, the overall market (pink line) was trending lower.
Therefore, UVSS was uncorrelated to the market and displayed short-term relative strength during that period.
These are the type of setups that I look for during a period of market uncertainty and selling pressure.
The Bottom Line
So, gang, to summarize the above: In a weak market, I don’t attempt to purchase short-term weak penny stocks that are not displaying relative strength to the overall market.
Instead, I focus on identifying penny stocks that display defensive characteristics and signs of bucking the overall markets trend.


1 Comments
The overlay of UVSS with the overall market to show uncorrelation is an excellent
demonstration.
But the correlation value could lie between +1 and -1. If this value is negative,
then I will confidently decide to enter my trade. If the value lies above 0, I will not.
Warm regards.