
Two days ago, I wrote about the importance of relative strength during uncertain times in the market.
In that piece, I discussed relative strength as a concept and how I am looking to identify setups that have shown relative strength versus the market.
If you need brushing up on relative strength, check out the piece I did earlier in the week.
Here’s a quick reminder of relative strength: relative strength is a strategy used to identify whether a particular stock has overperformed or underperformed versus the market or another relevant benchmark.
Sticking to the theme I previously discussed, gang, I want to provide a further example of a stock that has shown relative strength and, in doing so, has bucked the market trend over the last two weeks.
I am also eyeing this stock for a potential trade, so I will also share my thoughts and game plan!

Trans Global Group (TGGI)
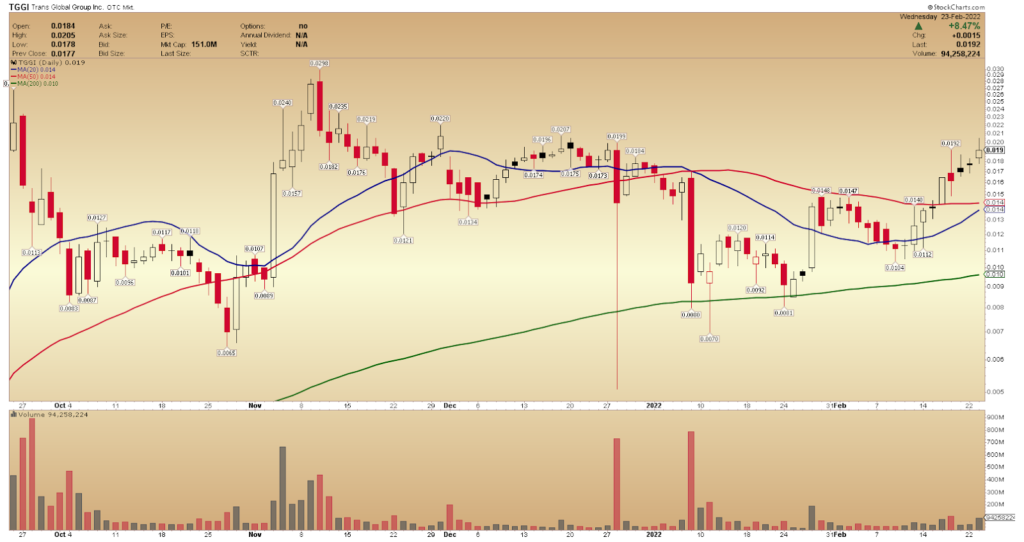
(Source: stockcharts.com)
TGGI, according to Yahoo, operates as an investment company that plans to acquire companies in the liquor industry in China. Previously, it was engaged in the general construction and renewable and solar energy sector.
TGGI Relative Strength
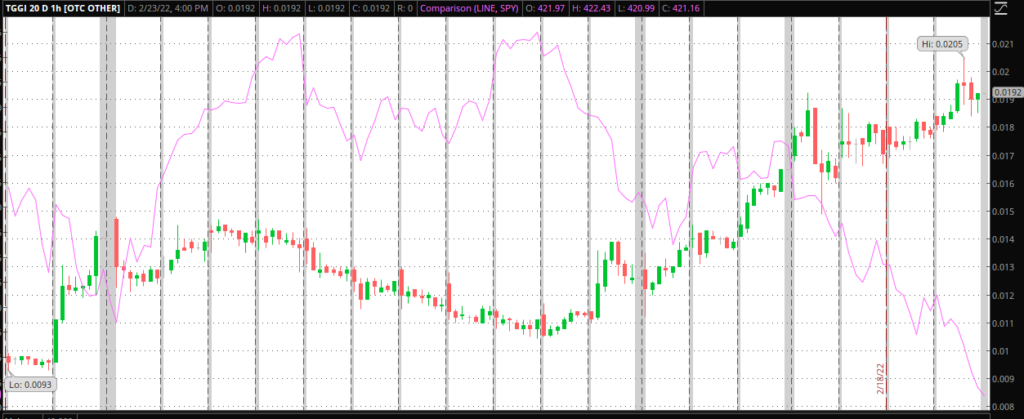
The above chart, courtesy of thinkorswim, displays the 1hr 20d chart of TGGI and the SPY price action over the same time (pink line).
As you can see, TGGI has trended to the upside during this period and remained in control by the bulls.
On the flip side, SPY has trended lower and appears to be controlled by the bears for the time being.
The overlay of the two charts above paints the picture, gang.
I can see that in the short term, shares of TGGI have bucked the market and shown relative strength.
Technical Analysis of TGGI
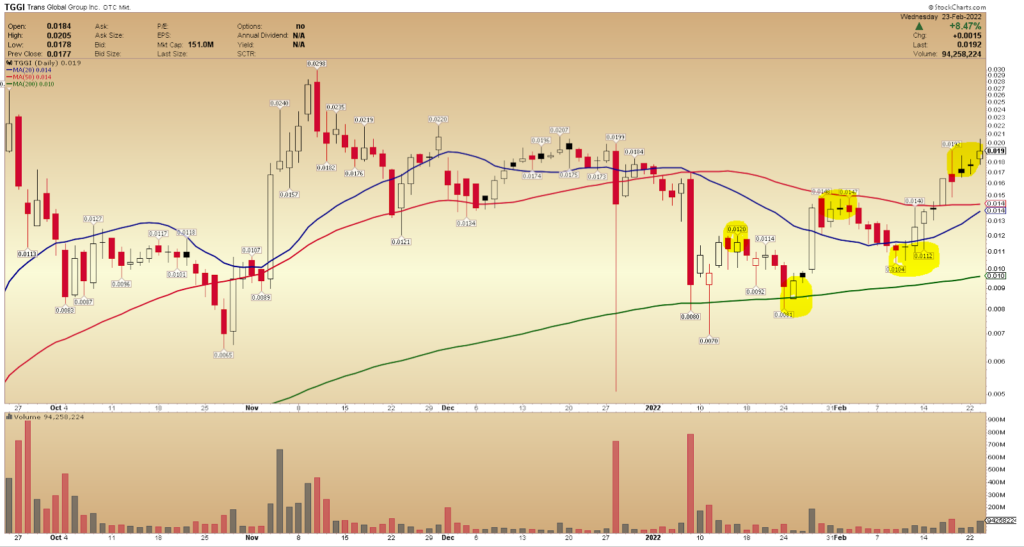
From a purely technical standpoint, a few things of interest stand out to me.
I like how the stock has traded above the key moving averages and held above.
I also like the higher highs and higher lows that the stock has recently developed, highlighted yellow.
My Game Plan
So, gang, considering the above, I am now looking for a potential entry around $0.016 to $0.0175.
I have that area in mind because I am looking for the stock to continue to put in higher highs and higher lows.
If the stock can confirm another higher low, I might look to enter and target the next level of resistance around $0.022 – $0.024.
The Bottom Line
As I have mentioned before, I like to keep things simple during these moments of volatility and correction in the broader market.
This is just one way and one strategy I use to keep things simple.
By focusing on small-caps that are seemingly uncorrelated to the broader market’s performance and displaying relative strength, I might be able to catch breakouts and momentum in a market that is trending lower.