
In my daily recap yesterday, I saw something that doesn’t always pop up – but is always worth reviewing when I come across it.
It’s called positive divergence.
I’ll explain what it is in a moment, but here’s why you want to learn it.
Half of the fun of day trading penny stocks is hitting on a big trend reversal. If I can enter a trade at the right time, I can take full advantage of the serious penny stock volatility and enter some promising-looking trade setups.
And of course, the hardest part is finding these setups beforehand.

With positive divergence, I can sometimes find these reversals before they really get going.
What is positive divergence? A primer
To find positive divergence developing, you need two pieces of information: the stock price and the MACD indicator.
Positive divergence happens when a stock is low or even sideways, but the MACD indicator is going up.
In other words, they’re trending in opposite directions: stock price down, MACD up.
Because these two shouldn’t be trending this way, it’s an indication that a stock price might be headed for a reversal in trend – and could start moving up.
Let’s take a look at a recent example of this:
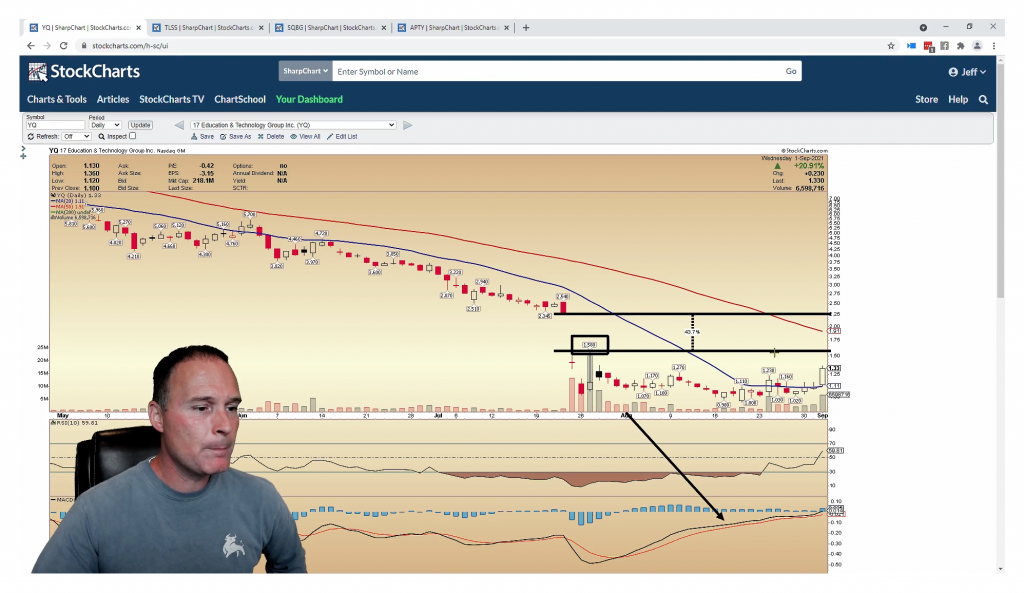
Now, I highlighted the gap here on YQ, but for now, you can ignore that.
As you can see by the arrow I drew, the MACD has been steadily increasing for a long time now.
Compare that trend to the stock price itself, which has kinda meandered and isn’t really going anywhere.
This is, of course, backed up by up-and-down trading volume, which isn’t really supporting any big moves yet either.
But because these two trends are diverging, I’m keeping YQ on my watch list.
How I use positive divergence in my trade plan
Now, what didn’t you hear me say here?
I didn’t say that I was buying up shares or entering any positions with YQ yet.
There are two reasons for this:
- Positive divergence isn’t a guarantee of a trend reversal. The only guarantees in life are death and taxes. Nothing on the stock market is guaranteed. So just because I see a promising indicator doesn’t mean that it’s necessarily going to move in the direction I expect.
- It’s not a standalone signal – it’s a tool. And like most indicators that I use, positive divergence is something that I use as part of a whole. I use it along with other conviction pieces to paint as complete of a picture of a stock as I can. If I can’t find a trade setup that works with my trade plan in this stock, I’m going to pass.
Instead of just jumping into a trade, I’m going to keep this on my watch list for a few days and see if a trade setup emerges.
I have to stick to my plan to be sure that it’s a wise risk to take. If there’s no trade setup for me, then there’s no trade.
As always, the decision is up to you. If you want to risk it and think positive divergence can produce a quality trade setup on its own… that’s your call. I urge you, as always, to paper trade your assumptions for a while first just to make sure that you know what you are doing before risking real money.
Whether or not I take the YQ trade at some point, it’s an excellent spot for education. Drop into the live trading room today and see if anything changes with YQ – I will follow up on this trade opportunity and see if anything promising has developed or not.


1 Comments
usually we see the term bullish and bearish divergence i use RSI not MACD. so a bullish divergence means rsi is oversold but the moving averages which is what i floow are still showing a downward trend and vice versa for a beqarish divergence do i have this right