
Safe to say, there were a lot more smiling and laughing bulls after the market finished green on the day yesterday.

I know my members and I had a great time yesterday in one of my chatrooms. Shoutout to my members because the ideas and banter were fantastic yesterday. Let’s keep it up, Gang.
Not only was the overall market positive on the day, but I noticed a lot more opportunities in small caps and penny stocks!
I noticed that the momentum and follow through to the upside in certain stocks types were superior to in previous sessions.
I spotted one of my favorite setups yesterday, a true bread and butter setup of mine, in a penny stock.
Of course, I alerted this idea and setup to my members early on in the day.
I wrote about the idea on one of my Watch Lists and shared it with members yesterday at 11.30 am.
Toughpoint Group Holdings, Inc. (TGHI)
TGHI trades on the OTC markets and has been a member of the OTCQB since 2019.
According to otcmarkets.com, TGHI is a media and digital technology holding Company. The Company invests primarily in sports, entertainment, and related technologies that bring fans closer to celebrities.
Market Cap: 12M
Float: 84M
Authorized Shares: 750M
The Setup
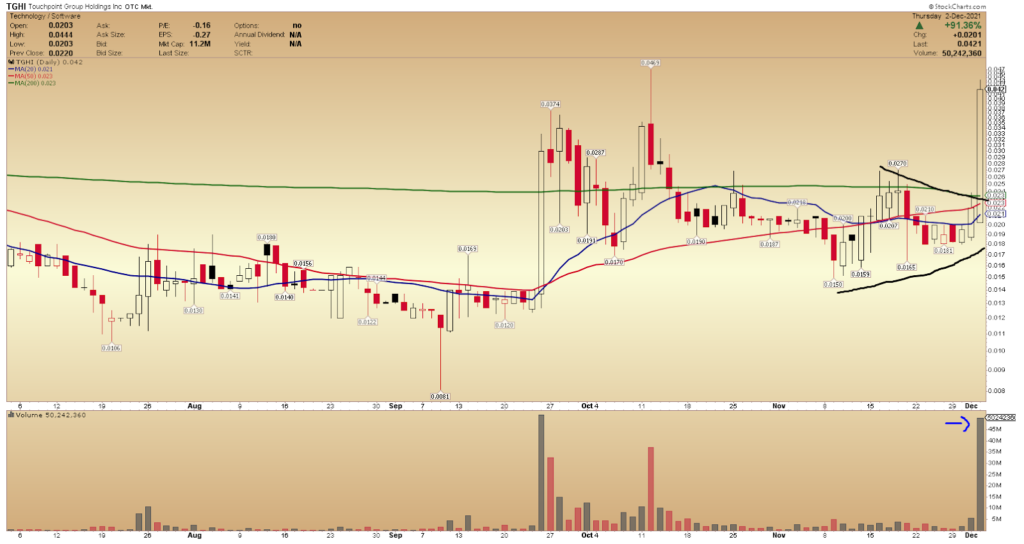
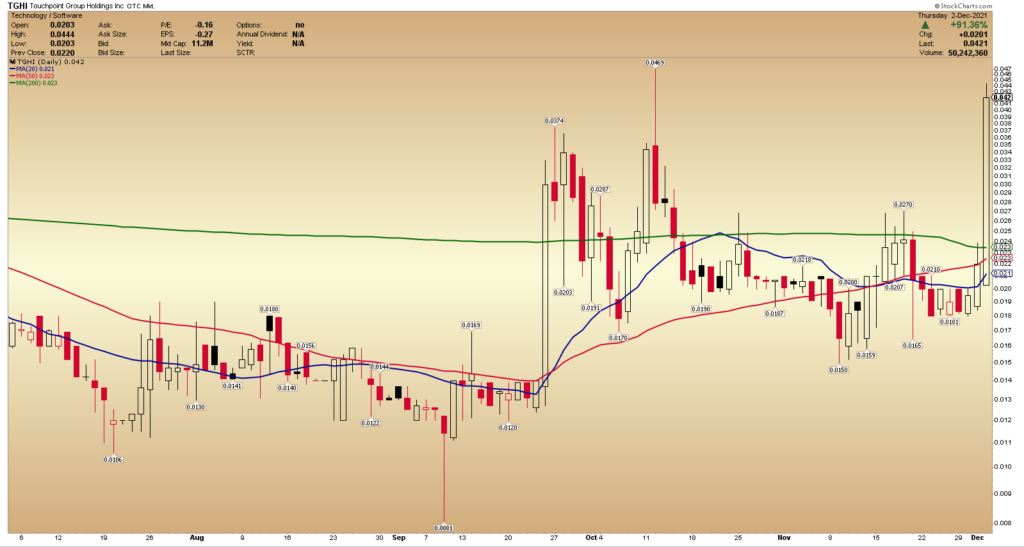
TGHI had developed a fantastic triangle pattern on the daily chart. It formed an ascending triangle, with the breakout level being the previous pivot high of $0.027.
At the time, I also loved the volume increase in the stock. The significant rise in volume in the stock led me to believe that this stock might have enough juice to test the $0.04 area.
The stock also broke above the previous pivot high of $0.027 and, importantly, held above this crucial level, with rising volume.
For the above reasons, the stock was on extremely close watch because it set up a consolidation breakout on the daily chart.
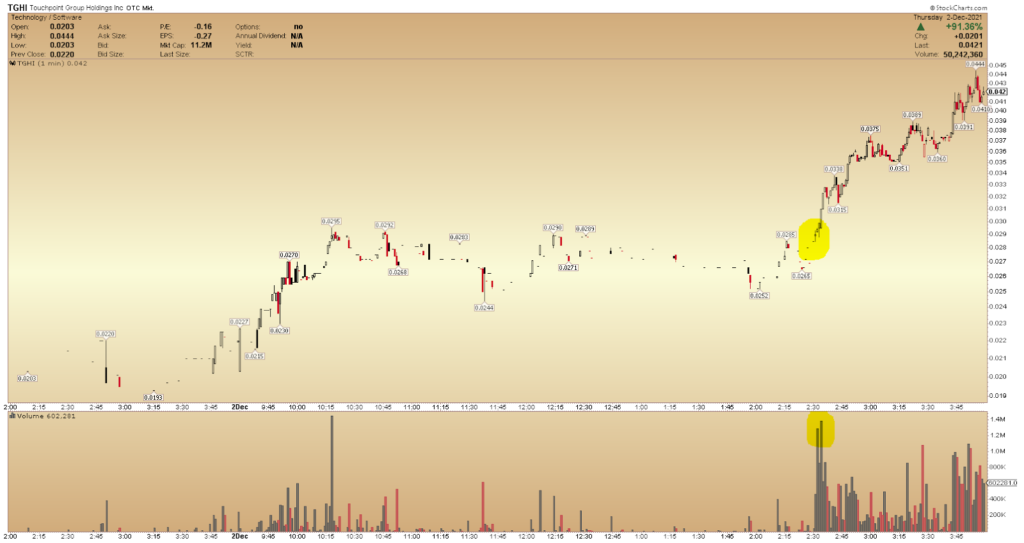
The intraday chart is a consolidation breakout pattern setup as well. So not only did the daily chart have a breakout pattern, but the intraday chart was also set up for a breakout and provided a fantastic entry opportunity.
The charts aligned well.
I was looking for an entry opportunity and planned to exit in mid to high $0.03s.
I got long TGHI when the intraday breakout was confirmed, with the range break and increased volume (highlighted in yellow).
I got long at $0.0297 at 2.50 pm, just as the stock was breaking out of the intraday consolidation.
I sold my long position at 3.20 pm, at $0.0376.
I posted a Making The Connections video yesterday for this setup and trade. The videos posted yesterday shows me, in detail, sharing my thoughts and plan for TGHI.
It’s available to you to view at no cost, and all you have to do is go to the member’s dash, and you will be able to find both an entry and exit video that I posted for this trade.