I’ve been saying it over and over…there has been a lack of follow through in the market lately, and that goes for penny stock land too.
At this point I feel like I’ve mentioned it so many times that it’s pretty much become the theme of my posts.
But it’s not all bad, I just want you to take note and be careful.
And to keep you prepared, I’m also going to show you how I might potentially trade the idea.
In my chat room Friday, I found a few gaps that made a perfect lesson on the gap-fail play.
Gap Up, Sell Off
First up, Greenpro Capital Corp. (GRNQ).
What do they do? Who cares…look at that chart.
The stock was up nearly 150% at the high on Friday morning. While that could have created a gap-and-go trade, it’s not what I’ve been seeing in the market lately.
Stocks aren’t going “to the moon” without looking back anymore…Now they’re looking back.
So let’s take a look at some of the signs that point to the gap-fail in GRNQ.
First and foremost, the stock was up over 100% overnight.
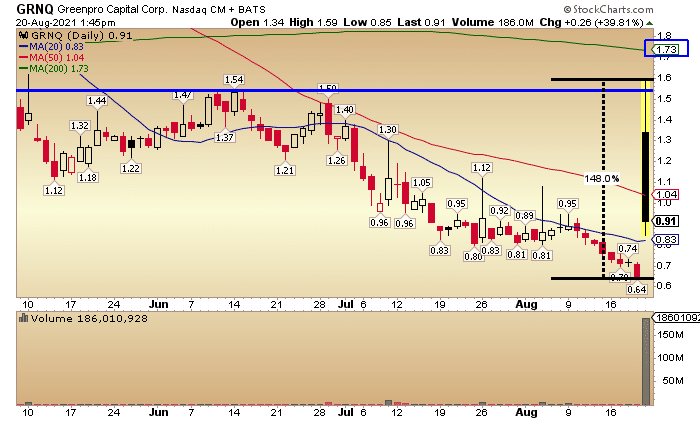
When looking at the daily chart below, I found a lot of resistance at the 1.50 – 1.60 range (blue line on chart)…and just above that is the 200 day MA at 1.73.
For that reason alone, if I was a buyer I would have been looking to get out in the 1.50 range to beat everyone else out before it hit that resistance level seen on the daily.
Now put that all together…If I’m looking at a stock that’s up 150% as it hits resistance…in a market that hasn’t been showing me any follow…could that be a short?
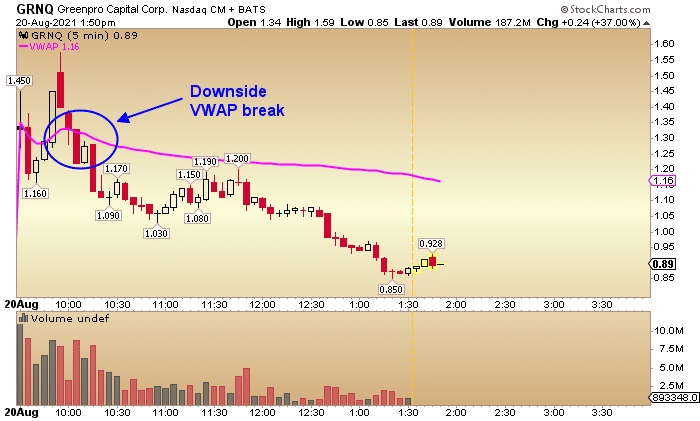
Look at the 5-minute intraday chart below, you’ll see what exactly happened on the open Friday.
The stock dipped…then made one last push to the high of 1.59 (potential resistance level seen on daily) before turning over and dying…and that’s when the short thesis came to play.
The stock had hit resistance, where it was up 150% at the time, and then turned over.
But at that moment it was above the VWAP (pink line), so I wouldn’t just jump on it willy nilly.
When GRNQ breaks below VWAP, that’s when I get potential confirmation to the downside.
And you can see what happened next.
After a few weeks of watching stocks pop and fail, that’s not the only one I had my eye on Friday.
Geovax Labs Inc. (GOVX) was on my screen as well.
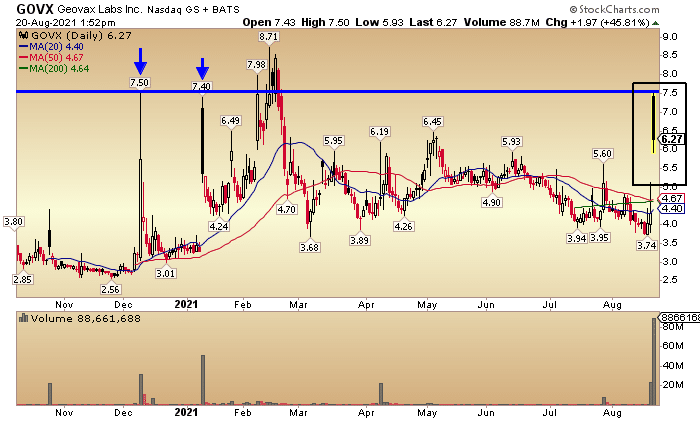
Take a look at the daily below. Clearly GOVX has made this move before.
I put arrows on two moves where it jumped and failed. In December the stock moved to 7.50 and failed, and in January the stock popped to 7.40 and failed.
Man those prices look familiar…oh yeah, Friday it popped to 7.50 and failed.
That was clue number one that this specific gap up may sell off.
Granted GOVX did push higher in February, hitting a high of 8.71.
More on that below…
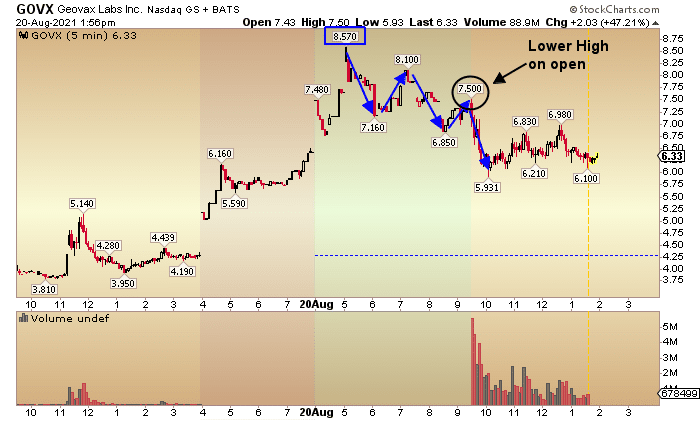
For that we’ll go to the intraday chart with premarket data in the green shaded area below.
Look at the high in the premarket…8.57.
And look at the pattern on the chart…stair step down.
GOVX made a move to 7.50 on the open and turned over…the stock was simply making a new lower high as seen in downtrends.
The downside risk was stacked against this gap up.
All I’m really trying to do here is give you another view of what’s happening in the market right now.
We are all so used to stocks going up with no regard for the downside risk. Well it’s time to keep it in mind and look at the clues.
Always have a plan and stick to it, just make sure your plan is based in reality.
Hopefully these ideas give you something to keep an eye on, no matter which side of the market you prefer.