
Today I’m talking about charts and price action. When trading short term, it’s not really about what these companies do.
A piece of news may come out and push the stock up, or down, big but ultimately what I need to know is all right there in the price action.
That’s why my main focus is always on the charts. Do I look at the news? Sometimes I do. I’m a trader, I pay attention to everything market related. And news, earnings, and the Fed all fall into that category.
But when it comes to making a trade, it really comes down to charts…patterns, indicators, and price action.
And that’s what I want to focus on today.
Looking at Previous Chart Highs
First up AUNXF.
In keeping with the theme today, I’m not going to look at news or even care to look at what the company does. I’m looking at the symbol and chart.
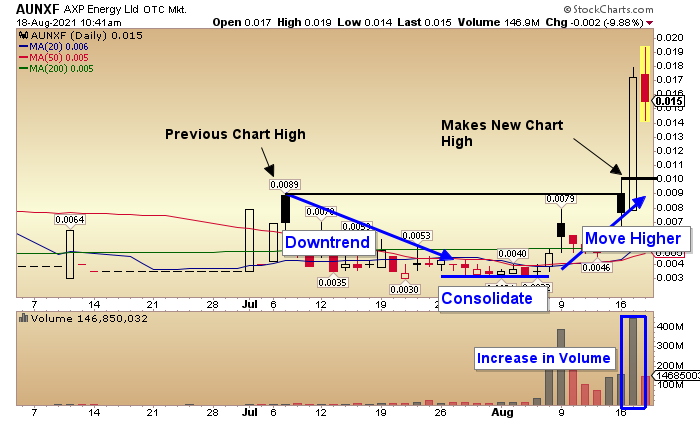
Looking at the daily chart below, The stock traded down after making a chart high of .0089.
Then it began to trade in a consolidation pattern, but there’s nothing that says it can’t consolidate for a year or two, or even worse, consolidate and move lower.
For that reason, I am not a buyer in the consolidation pattern alone…I want to see a move up, out of consolidation.
With AUNXF I perked up when the stock popped above the previous chart high making a new high of .01, however it didn’t hold above the .0089 level on the day.
But now I had my eye on it. And yesterday the stock continued up on a big spike in volume.
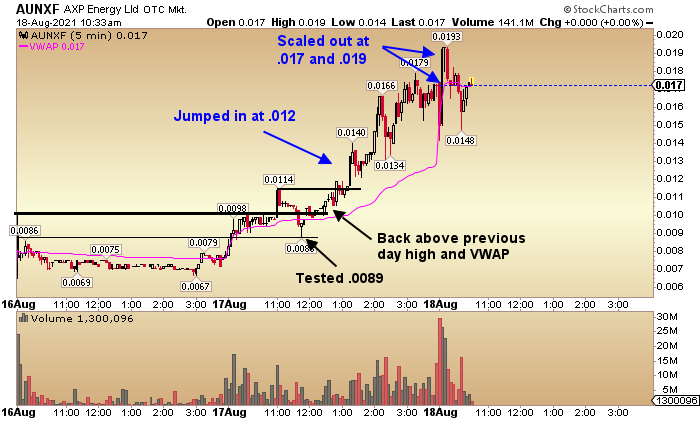
Looking at the intraday chart below, after breaking above .01 yesterday morning, AUNXF traded back down to test .0089 and held that level.
On a move back above VWAP (pink line) and breaking the morning session highs, I jumped in at .012.
The very next morning I was scaling out of my position between .017 and .019. You do the math.
This is nothing new. I’ve been writing about why I’m looking for targets the next morning for weeks now. With the current state of the market, anything can happen and these momentum moves haven’t been holding up for days like they did a few months back.
So I want to be in AND out while the stock is making a move to keep from being caught holding the bag.
It’s just about paying attention to what is happening and what I am seeing in the market, planning for it…and following my plan.
Premarket Price Action Tells a Tale
Take a quick look at this daily chart for PMCB…
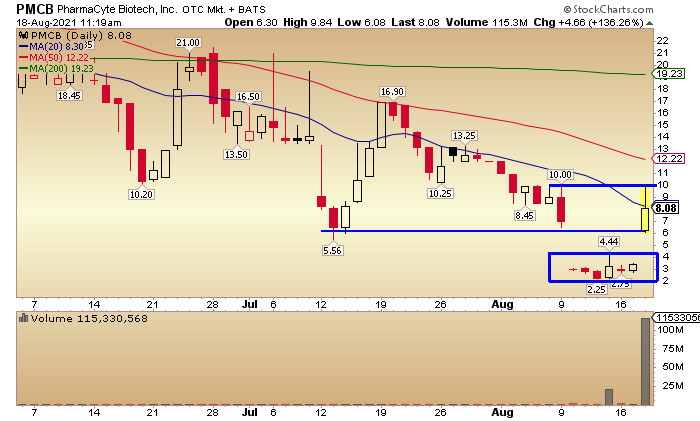
The stock gapped up from under $4 to over $6 on a surge in volume. But how is this even tradeable?
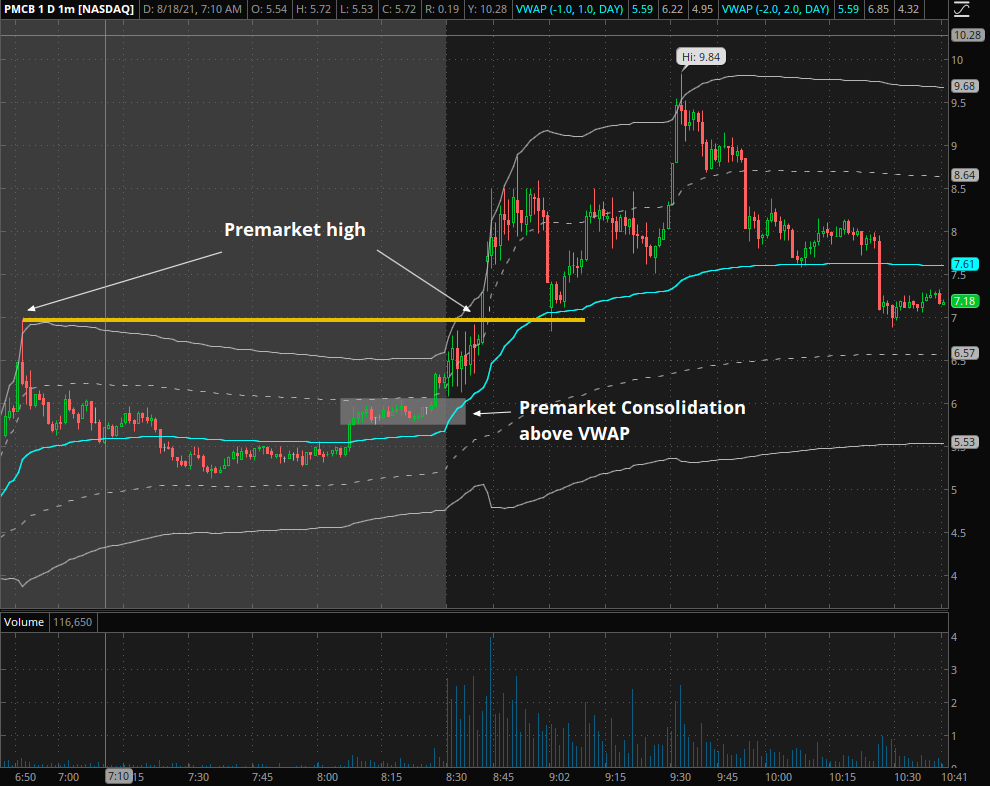
For that I’m going to switch to a 1 minute intraday chart for Today (the shaded area shows the premarket trading).
Below I marked the premarket high with a yellow line. And you’ll also see a premarket consolidation above VWAP I pointed out that occurred just before the opening bell.
These are two areas I find to be significant in the premarket price action for PMCB.
Now that I have my levels of significance to watch, it’s about the price action into the open.
Take a look at the chart below (same chart, but pointing out trade potential in the price action).
The first move is a break above the previously talked about premarket consolidation above VWAP (light blue line). PMCB broke above this range just before the open, and then retested it a few times in the first 5 minutes.
A buy above that range is the first chance I see to get into a gap move like this.
The second option here is the move above the premarket high of $6.98.
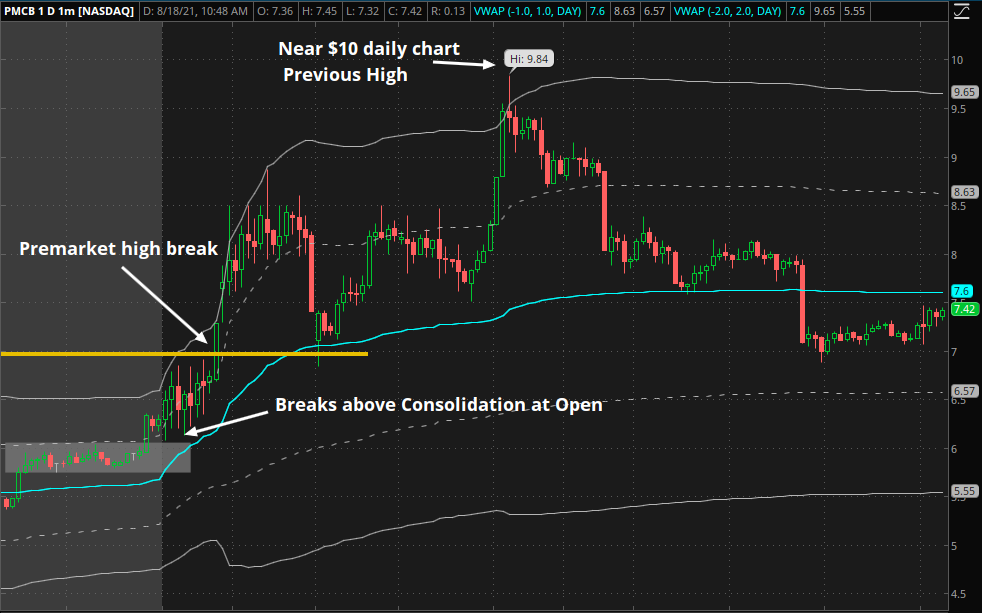
As you can see, the stock then shot up to over $8.80 before making a move back to VWAP and bouncing there for a move to $9.84.
What’s significant about $9.84?
Go back to the daily chart above…you’ll see the previous chart high was $10. And as you know, I like to sell just below resistance levels like the previous chart high.
With gap-up stocks like PMCB today, I like to let the intraday charts talk to me.
Looking at the premarket, I am watching price action around significant levels such as the pre market highs and lows, as well as consolidation levels.
While I do pay attention to the reasons a stock may be moving, the most important piece of the puzzle for me is simply the price action.


2 Comments
GREAT PREMARKET EDUCATION FOR OLD AND NEW RAGING BULL MEMBERS. LEARNING FROM THE PREMARKET CHARTS FOR ME IS OF VERY HIGH VALUE TO CONFIRM MY DAILT PLAN AND THEN TRADE MY PLAN. 🙂
Thanks for the information Jeff.