

As you should probably know by now, I have two absolute favorite setups.
The Consolidation Breakout Pattern and the Higher High Higher Low setup.
After a slight, quiet period in penny stock land, it appears that things have picked up post-thanksgiving. I have been noticing more stocks on my scanners throughout the day, more volume, and breakout opportunities across the board.
And, of course, I’ve also been noticing more of my favorite setups.
If it’s a sign of what’s to come in 2022, then it should be an opportunistic year ahead, gang!
Well, yesterday was phun, phun intended, I mean pun intended. Because I identified and shared an excellent consolidation breakout pattern in the chatroom.
If you were in the chatroom yesterday, you would have caught me discussing the setup, chart pattern, and opportunity in PHUN.
According to Yahoo, PHUN and its subsidiaries provide an integrated software platform that equips companies with the products, solutions, and services to engage, manage, and monetize their mobile application portfolios worldwide.
Key Stats, per Finviz:
Market Cap: 434M
Short Interest: 4.58%
Float: 62M
Average Volume: 33M
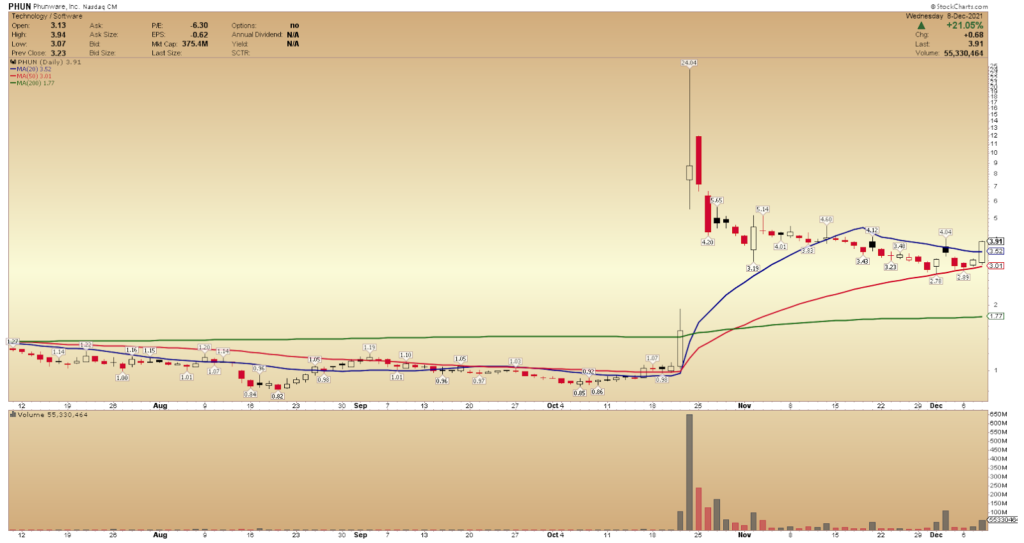
For the last couple of days, I have been telling my members in the chatroom that I am keeping an eye on PHUN as the stock is consolidating.
The stock had a significant run-up in October, pulled back, and has based over the key moving averages for about a month now, with the volume dropping off.
I love how the stock has recently held cleanly above the 50d MA, and the 20d MA has tightened up close to the 50d MA, creating a possible rubber band effect.
Yesterday, however, the stock saw a slight uptick in volume and broke above the 20d moving average, and closed above it.
The stock closed up 21.05% yesterday and traded 55.3M shares.
It’s important to note that PHUN, since the run higher in October, moves closely with DWAC as the stock is viewed as a sympathy play to DWAC.
As DWAC advanced yesterday, so did PHUN.
So in the future, it might be necessary also to keep an eye on DWAC.
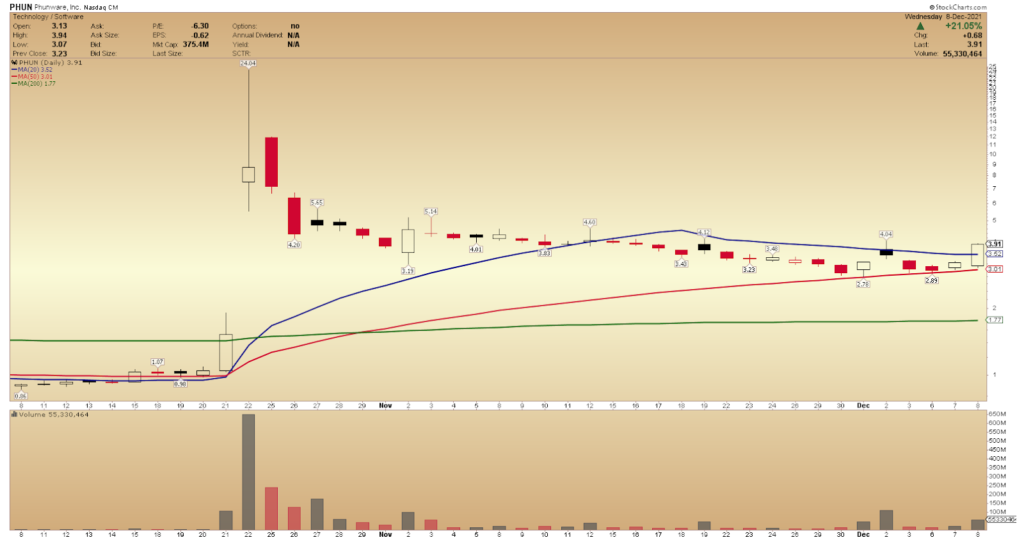
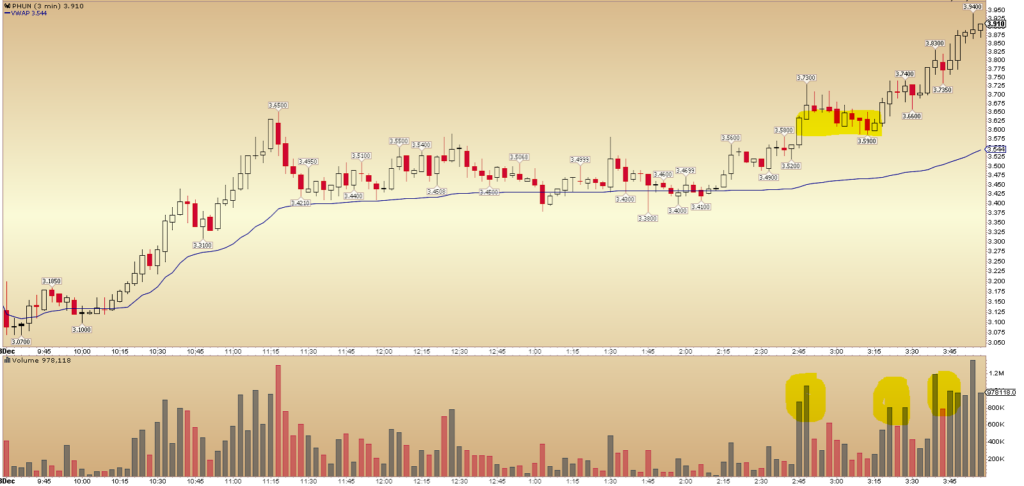
As you can see from the intraday and daily chart above, a consolidation breakout pattern occurred in both time frames. Often, when the time frames are aligned, it signals that the breakout might have added momentum.
After the stock-based above the intraday VWAP, volume increased on the consolidation breakout above $3.60, and the stock closed near the high of the day. This is a bullish sign.
With the consolidation breakout pattern confirmed, with the volume increase and the stock holding above the intraday VWAP from yesterday, a long position might have been entered at or above $3.60, with a stop placed below the intraday VWAP.
A suitable profit target on the position could have been $4, which is resistance from the consolidation.
As I mentioned earlier, going forward it might be necessary to pay close attention to the action in DWAC as any volatility in that stock or breaking news might affect the price action and performance in PHUN.


2 Comments
Jeff, I Really enjoy your analysis, I love your penny stock that you talk about. I miss your morning blog that you use to have.
I’m glad you’ve been enjoying the articles Robert! We will keep them coming. I’m happy to see the penny stock markets starting to trade more lately. It’s encouraging to me. Cheers