

When it comes to trading stocks, it’s one thing to know what I am looking for…
But it’s another thing altogether to find it.
The good news…
All I need is a simple stock screener with the right criteria and the scan does the dirty work for me, narrowing the stock universe down to just those that fit my criteria.
With a few clicks of the mouse, I’ve taken the whole of the stock universe down to a handful…saving myself all kinds of time.
And the best part…It’s Free.
Scanning For Trade Setups
The purpose of my end of day scan is to find stocks that could give me a trade setup.
In my experience, it’s best to keep it simple.
So let’s dive in…
What’s in a Scan?
Obviously I need a trading strategy, that goes without saying…how else will I know what to screen for?
The purpose of a scan is to find stocks that fit the criteria of my trading strategy, quickly and easily.
A scan lets me define the specific criteria so I will only be looking at stocks with potential…
Time is money… so scans have massive value as they are easy to develop and run.
At this point, you are probably wondering why you aren’t already using one… or better yet, why hasn’t anyone told you about them before?
Well, whatever the reason… After today, the value of a scanner will be much clearer.
Developing a Screener/ Scan
Creating a screener only takes a few clicks of the mouse, and once I get it set the way I want it… I can even save it so next time I am just one click away from my tradable universe.
For the most part, I trade penny stocks and small caps, and use a few basic technicals along with my simple chart patterns to find my trades.
To find stocks meeting my criteria, I use a simple free screener found at finviz.com.
Free “finviz” Screener for Quick Scans
Here’s how it works…
(Note: these are the actual criteria I am using for my scans every day)
Under “screener” at the top of the page, I enter my criteria under the “descriptive” tab and the “technical” tab as seen below.
- Descriptive Tab:
- Price: under $10
- Current volume: over 400k – need liquidity.. No bag holders here.
- Average Volume: over 400k
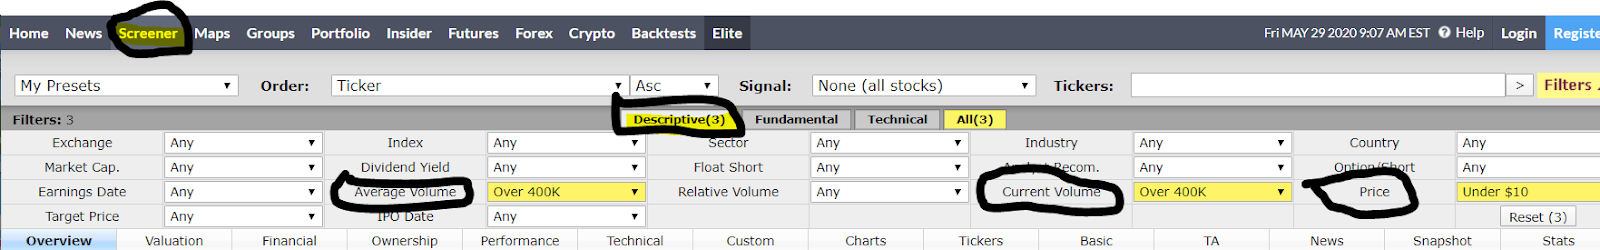
- Technical tab:
- Performance: up over 10% today
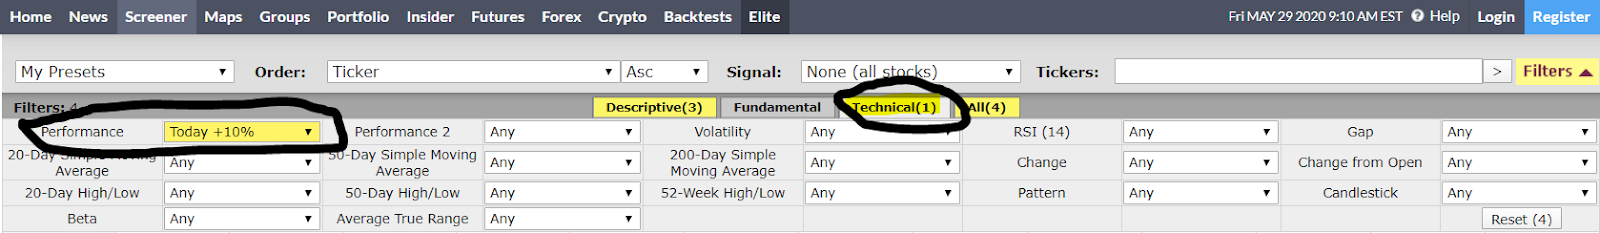
It’s that simple…
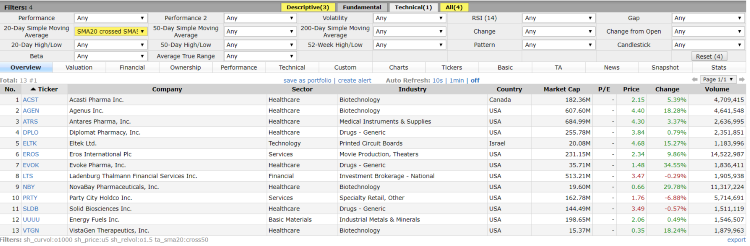
And by doing this I am able to take thousands of stocks down to 10-30 (depending on the day) that meet my specific criteria.
The results come out looking like this:
How could I possibly find stocks that are meeting my trade parameters when there are thousands to look at?
That’s the value of a stock screener… by using a handful of dropdown menus, I can narrow down thousands of stocks to a focused core that meet my trading criteria.
These are the stocks that will give me the best odds of finding a trade setup according to my preferences.
And now I can move on to skimming through the charts for potential setups without being bogged down with too many charts to look at.
Scrolling Charts For My Patterns
Now that I have my results, I simply click “charts” and then “candle” (both circled in image below) and it turns my list into a chart view as seen below.
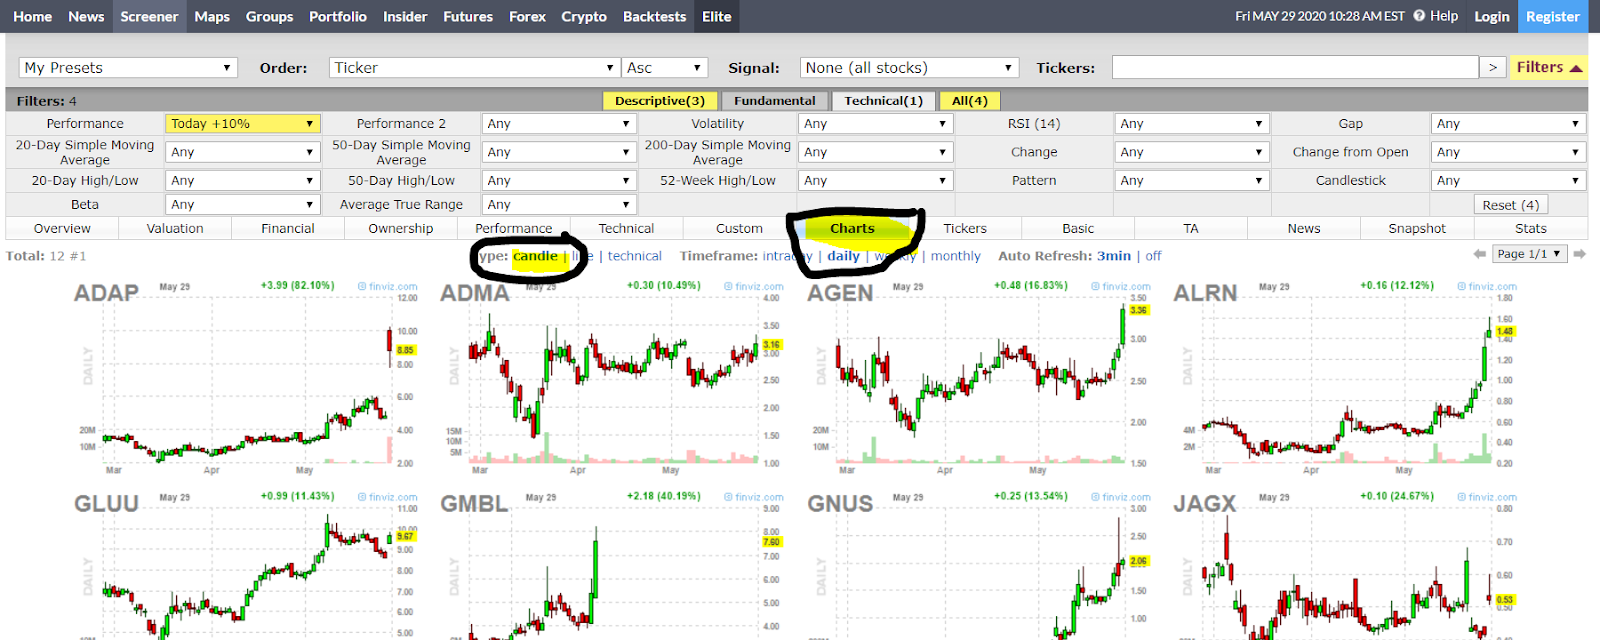
This gives me a visual look at the price action so I can quickly see any patterns that pop up.
I’m basically just looking for 2 things here… I want to see one of my two bread and butter patterns, the stair step pattern or the consolidation into a move higher.
A stair step consists of higher highs and higher lows.
And the consolidation pattern happens when a stock has leveled out into a tighter range. This looks like a sideways resting phase…and I’m looking for that pattern into a move higher.
I like to describe it as a simmering pot of water getting ready to hit the boiling point, and I am trying to grab this as it starts to boil… which is the break above the consolidation.
After years of doing this…I can spot these patterns with just a glance at the charts and narrow the 27 or so stocks down to my final list for a deep final dive to find that one special trade.
So I simply scroll through the charts and look for stocks trading out of a stair step or consolidation pattern. Then I make my short list and dive in to find my trades.
But I’ll get into the “deep dive” in a future post…
For now… I have one last note on using the screener.
I showed you my personal criteria…but you might be looking for something else.
I just wanted to point out that there are so many options to choose from…no matter what it is you’re looking for in a stock, it’s probably there.
For example…
I can screen for fundamentals like earnings, margins, and growth… technicals like moving average crosses, candlestick patterns, and gaps… and basic descriptive elements like price range, volume, and industry… and of course so many more…
Play around with it a little and familiarize yourself with all of the options.
You might end up using it as part of your normal routine…
And if you are new to my letter, or missed any along the way…you can check them out here

Comments are closed.


4 Comments
Great information that you shared do graciously with understanding thanks.
Great explanation, looking forward to continue learning the different techniques.
still learning thanks
Really clear baseline understanding for your trading room