

Due to inflation, it appears the FED has no choice but to raise interest rates. This has already been reflected in increased real mortgage repayments for home buyers.
If that weren’t bad enough, geopolitical factors have disrupted supply chains meaning the price of food and gas has also gone up significantly. This means ordinary people have less disposable income, and with higher costs of living and mortgage repayments, they will probably be buying a lot fewer houses!
That’s really bad for the Real Estate sector. Not only are the fundamentals bad, but the technicals are also lining up Bearishly! The Professor has Identified a classic bearish technical idea setup that could send this financial instrument much lower!
Chart of 20+ year treasury bond ETF- TLT
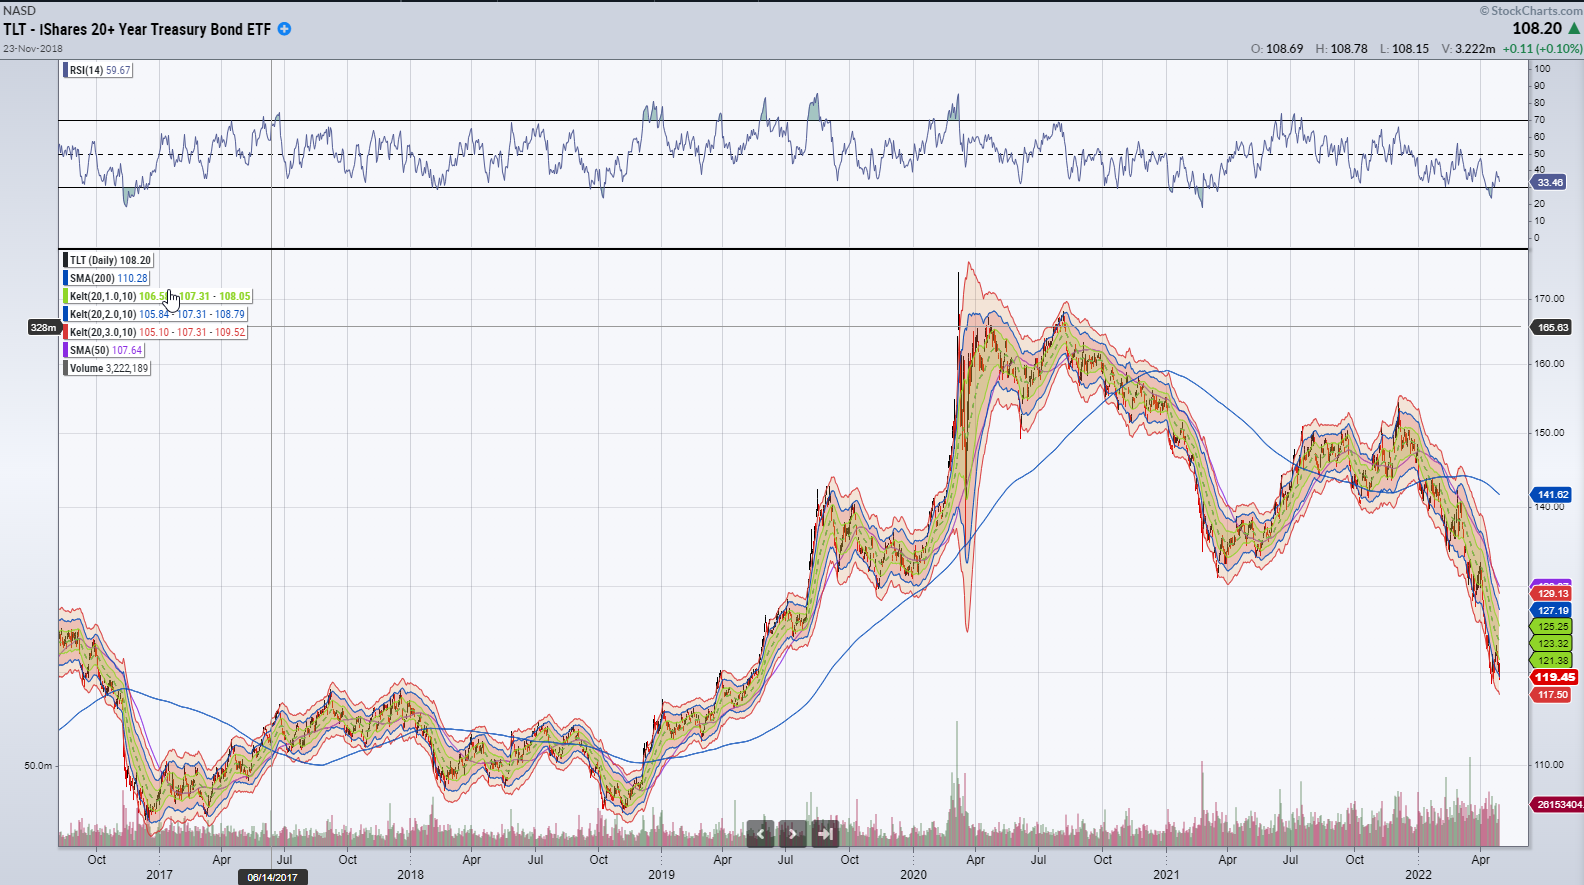
The bond market continues to sell off. As bond prices fall, that means interest rates are going up.
Chart of Real mortgage payments in the U.S
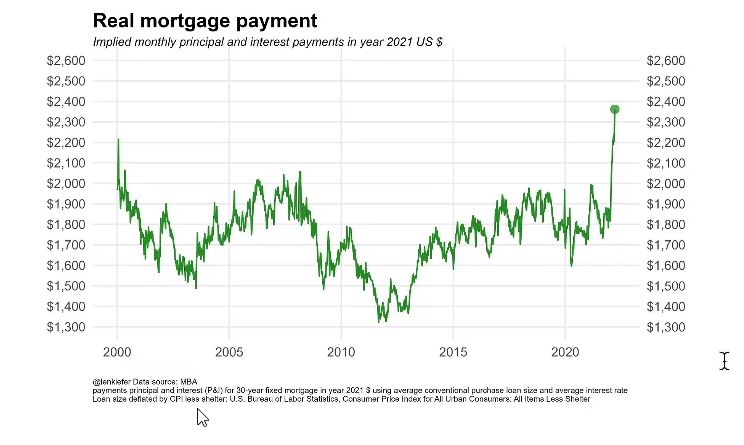
As housing prices and stock markets rose, real mortgage payments stayed low over the last 10 years due to low-interest rates.
However, due to rising inflation and interest rates, real mortgage payments have spiked from below $1,800 to over $2,300 over the past few months. This has longer-term ramifications for the economy as people have less money for discretionary spending and could hit the economy in the longer term!
This could mean property prices begin to fall, which can affect how much people can borrow and invest! How do you play a cooling housing market?
IYR
INVESTMENT OBJECTIVE
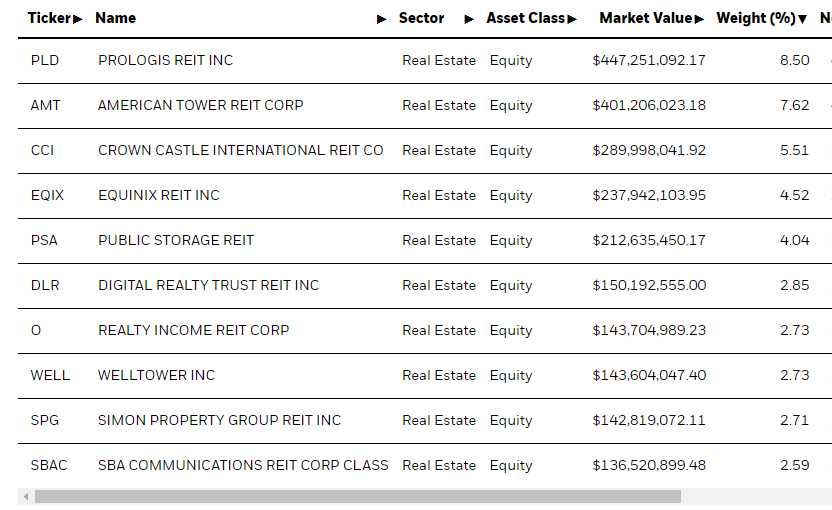
The iShares U.S. Real Estate ETF (IYR) seeks to track the investment results of an index composed of U.S. equities in the real estate sector.
It has exposure to U.S. real estate companies and REITs, which invest in real estate directly and trade like stocks.
Mostly the fund invests in REITS, but also has some exposure to real estate services.
Here are some of the holdings in IYR:
Technicals
Here is the Professor’s Trade Idea Setup sent out to subscribers on Friday:

IYR Daily Chart
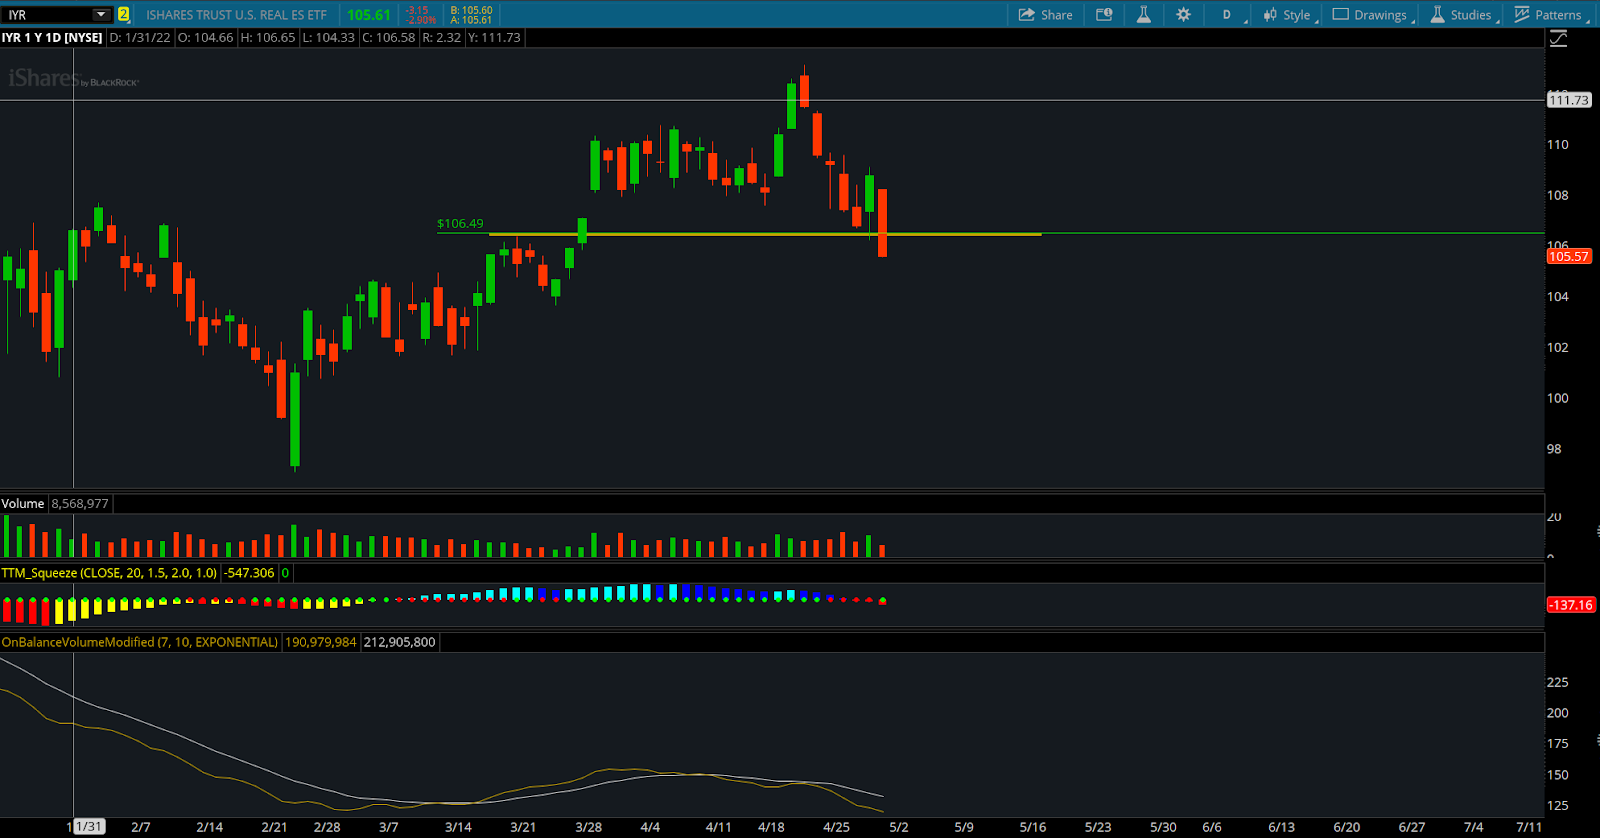
Trade Setup:
- Break of Support: Break of support levels have bears piling into this trade to the downside. This should accelerate the momentum to the downside as bears jump in.
- TTM Squeeze: The TTM Squeeze is showing a dropping momentum histogram and a squeeze is being shown with 4 red dots at this time.
- On Balance Volume: OBV bearish and trending lower from here showing a bearish divergence in the main chart.
Trade Details:
- 20 MAY 105 Puts


