

If you want to learn how to be a successful trader, you’re going to have to learn how to do three things:
- Leave your emotions at the door
- Effectively manage risk
- Learn to embrace volatility
Trust me when I tell you that, more than the market, it’s a trader’s inability to handle these three items that can ultimately end his or her career.
When the market gets ugly and investment accounts are bleeding red, traders who practice proper risk management and position sizing are the ones in control and ready to take advantage of discount prices when other retail investors are panic selling.
As US equity trading was just getting started this past week, many investors were still shell-shocked from the heavy selling that took place late last week.
But for Total Alpha members, access comes with live video sessions that offer me the opportunity to walk them through what I’m seeing in the market in real-time.
One of the more recent examples of how this timely insight helped put traders on the right side of the market comes from the Master’s Club session this past Monday, where I pointed out how a key sentiment gauge had combined with a popular price pattern to signal that the market was ready to bounce.
Today, I am going to break this setup down for you.
Knowing when it’s time to buy after a sell-off takes practice
With equities rallying this week, it appears that the markets are trying to shrug off the inflationary fears and lockdown potential from the new variant that hit the news wires last week and this week.
And I’m happy to see that technically we are starting to make improvements to the overall markets.
Is this the market telling us that the Fed may be hesitant to take away the “punch bowl” in light of the recent virus-related fears?
It’s certainly possible, but I am more inclined to think that it’s primarily due to the fact that so many traders bought puts last week, betting on a market collapse, and that caused things to become so one-sided that these new bears are now being forced to cover those shorts.
On Wall Street, some of the most successful traders are known as “contrarians.”
In other words, these are the traders that wait patiently for sentiment to become so stretched in one direction that there’s simply no one left to chase price, causing the air to come out of the trade, which results in a trend reversal.
So how did I know that put buying had become so extreme last week?
Well, by using a very popular timing tool known as the CBOE Options Equity Put/Call ratio.
In Figure 1 below, I’ve placed this indicator on the bottom panel of the chart, with the S&P 500 in the top panel.
You’ll find that I am using the popular charting service Stockcharts.com to create this chart, which is what I use in my daily updates and in my Master’s Club videos. The ticker for this indicator when using Stockcharts.com is $CPCE.
Figure 1
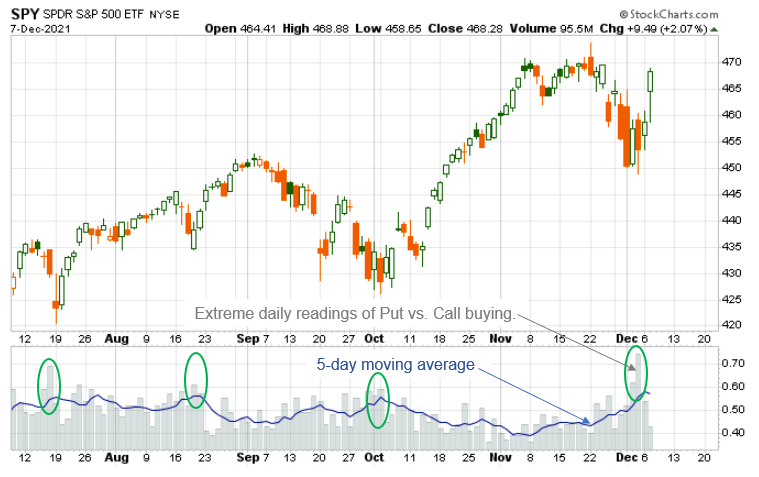
Now, it’s common to apply a short-term moving average like the 5 or 10-day moving average to the put/call ratio to help smooth out its noisy swings.
In this example, I am using the 5-day moving average (see blue line in the bottom panel).
Essentially, when this ratio is high there are more people buying puts than there are buying calls, which means there is a bearish bias in the market.
But when the moving average reaches extremes, it’s an indication that there has been a recent trend of sentiment growing to a bearish extreme.
More often than not, this alerts traders to the fact that market conditions have probably become too negative for the selling to continue without some degree of a bounce occurring to alleviate this negativity.
Just like any indicator, however, the put/call ratio is not a perfect timing tool, and it is best used in conjunction with areas of price support and noteworthy price patterns to find the most reliable signals.
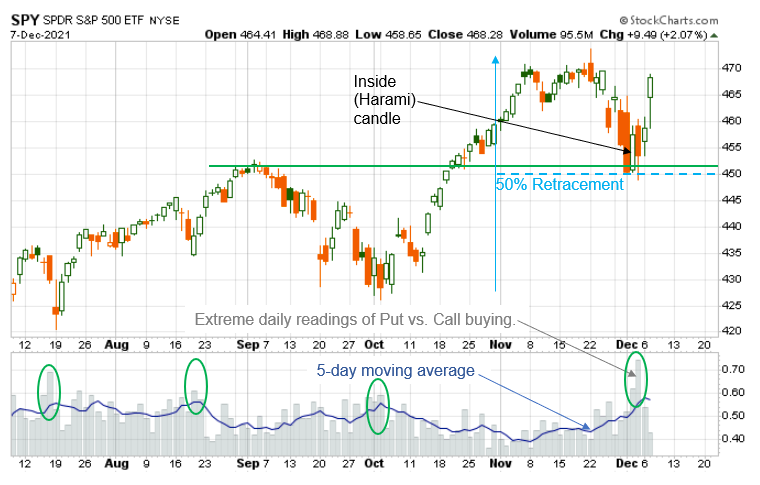
In the case of the most recent bottom, Figure 2 highlights that the extreme put vs. call buying that occurred last week was accompanied by an inside (harami) price candle while the S&P 500 was testing the late-October breakout area (former resistance turned support) and the 50% Fibonacci Retracement of the entire October through November rally.
On their own, these “harami” candle patterns are an indication that sentiment may be shifting from bearish to bullish.
But it’s the added support of the extreme put/call reading that increases the odds that the shifting sentiment will result in a price reversal, at least for the short term.
Figure 2
Conclusion
Traders love volatility because it produces opportunity in both directions. But knowing when to switch market sides takes a lot of practice and knowledge of key market indicators.
Facing scary conditions like we witnessed last week on your own, especially when you are still learning how to practice all the things needed to become a successful trader, can be daunting.
After many years of trading and educating traders, I’ve learned to embrace these conditions, and I love nothing more than being in the heat of battle with members helping them choose the right weapons and strategies to use to survive.
To YOUR Success!


4 Comments
Hello!
I liked this publication very much. I wanted to reproduce this picture using Stockcharts.com, but I couldn’t. If it possible, show how it can be done.
I’m interested
good insight my brother.
Thanks