I think the market is overdue for a pullback, and that volatility could return to the market soon. You can read about that in more detail HERE.
Similarly, the Professor has identified 2 Bearish trade setups that he thinks could continue lower.
DNUT
Krispy Kreme, Inc (DNUT) together with its subsidiaries, operates through an omnichannel business model to provide doughnut experiences and produce doughnuts.
Now I love Doughnuts, but since its IPO, DNUT has been trading very weak. The Professor has identified a Bearish Setup that he loves, and here is the analysis he sent out to subscribers on Friday, April 01:
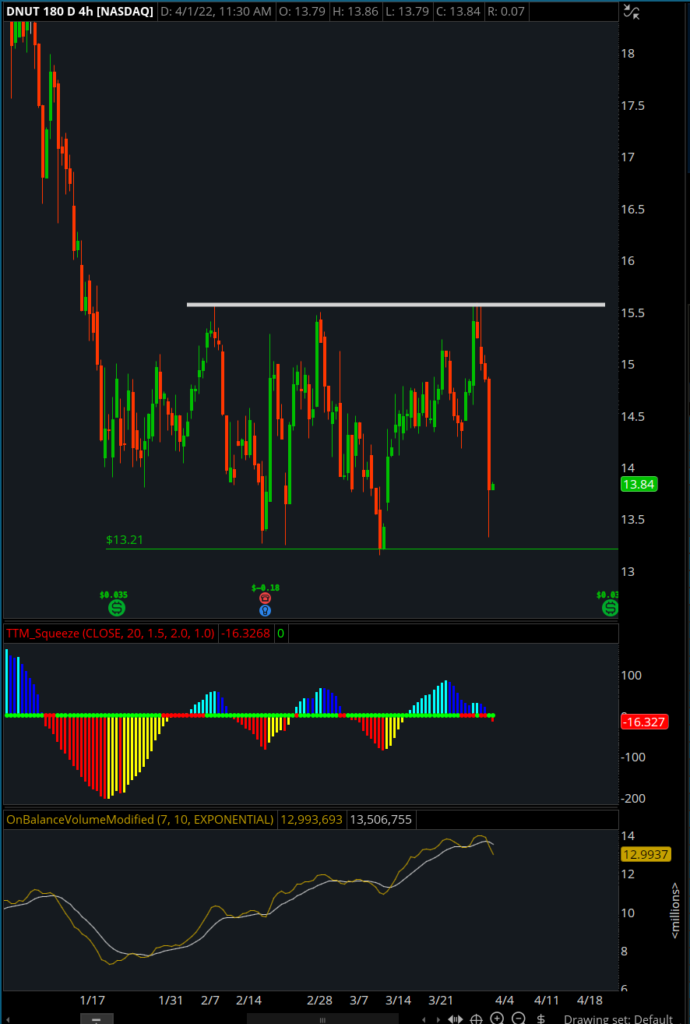
DNUT 4 Hour Chart

Trade Set Up:
- Triple Top Selloff: The triple top confirmed the bears took control and are now pushing the stock lower to the downside. I’m thinking that the bulls won’t defend the lower support for a triple bottom. If this happens, I’m going to look for momentum lower
- TTM Squeeze: There is no squeeze right now but the histogram is supporting downward trading momentum out of the bears. I want to see the histogram continue to push lower from here.
- On Balance Volume: The OBV is bearish at these levels even though it is at the top of the range. This means the bears are starting to push the bulls out of the way and might begin the trend lower.
Trade Details:
- Target $12.56
- Target $11.74
- Target $10.85
- 20 May 12.5 Put
CWH
Camping World Holdings, Inc (CWH), through its subsidiaries, retails recreational vehicles (RVs), and related products and services. It operates in two segments, Good Sam Services and Plans; and RV and Outdoor Retail.
The re-opening trade post-Covid looks to be over for the most part. Generally speaking, everyone who was going to buy an RV has already probably bought one. Given the high gas prices, it is even less likely that consumers will purchase RVs in the short term. CWH has been in a downtrend since January and I think that is likely to continue.
Here’s The Professor’s technical analysis sent out to subscribers on Friday, April 01:
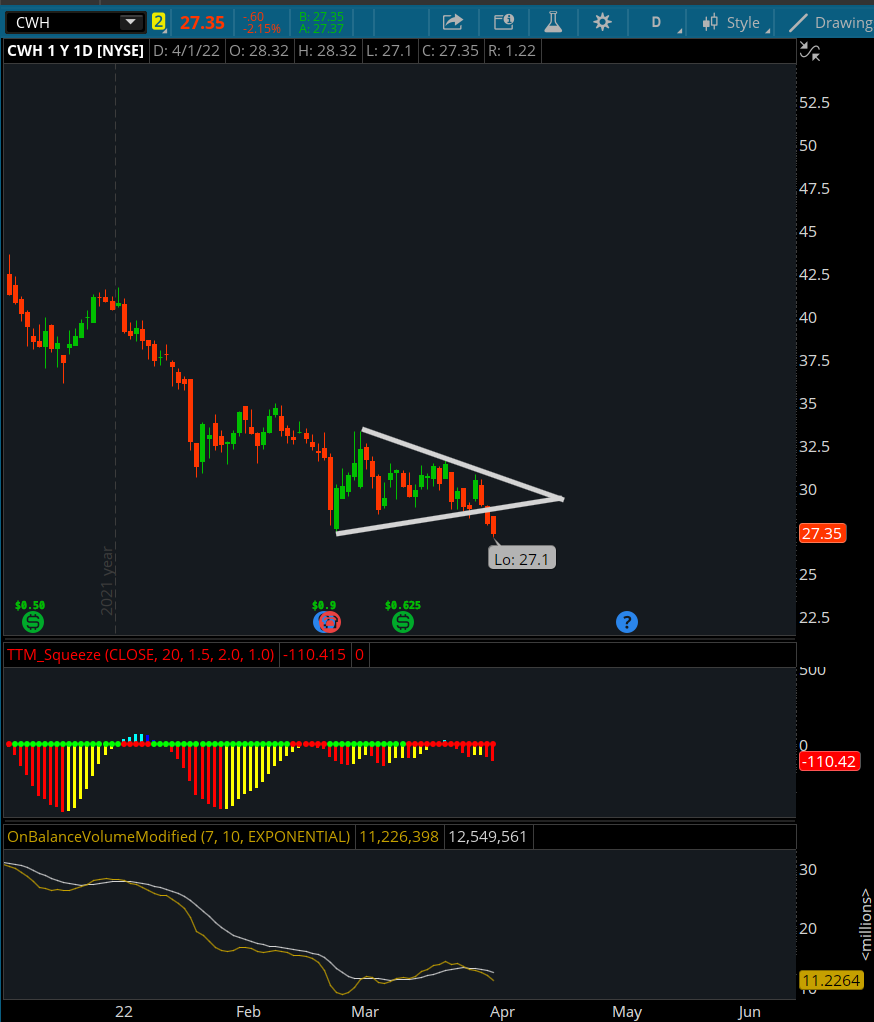
CWH Daily Chart

Trade Setup:
- Triangle: The triangle pattern was formed when the bulls and bears couldn’t agree on a direction to take the stock in. Now that the bears have taken control of the stock, the breakout is showing an increase of momentum to the downside.
- TTM Squeeze: Red dots on the squeeze with negative trading momentum on the histogram. A bearish sign, suggesting lower prices are going to follow.
- On Balance Volume: OBV is bearish here, and continues to show lower values on the chart. I want to see this trend resume with more bearish OBV values to show me that buyers are not sticking around.
Trade Details:
- Target $25.26
- Target $23.04
- 22 APR 28 Put
The Professor has live training sessions daily for subscribers.

The Professor, Mike Parks, is Raging Bull’s Senior Training Specialist.
Mike is a veteran trader and educator and is adding a level of insight to Total Alpha that can only come from decades of experience in trading and market education.
Mike has incredibly knowledgeable about all things markets and his talent for teaching new traders how to use market signals to choose the right options strategies is unmatched.
Comments are closed.


1 Comments
Ooooops,,,why only 18, not 28, trading days? Pete