

AAPL was up 11 days in a row!
The VIX has been cratering.
It appears on the surface that the bull market is back, and all our worries have gone away! But if we take a deeper look at macro factors tied to interest rates and volatility, all is not as it seems. I think volatility is set to return soon, and this is not a market in which to be complacent.

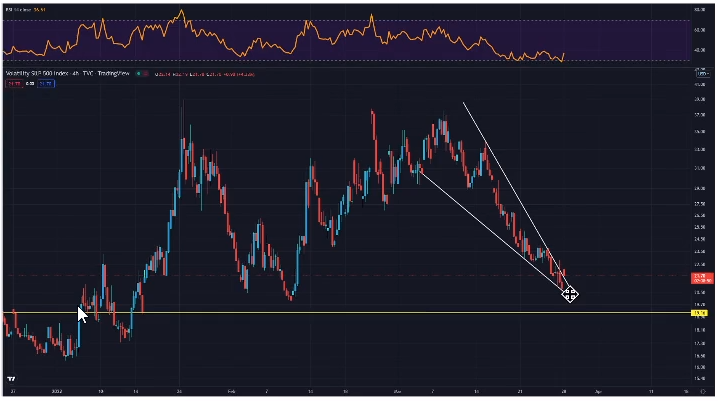
4-hour chart of VIX over the last few months
Here is a chart of the VIX. What is the most likely move out of this pattern? I think the next move is likely up! In fact, given the number of uncertainties out there, I think the VIX could see mid 20’s even 30’s again. Let’s look at another chart of the VIX.
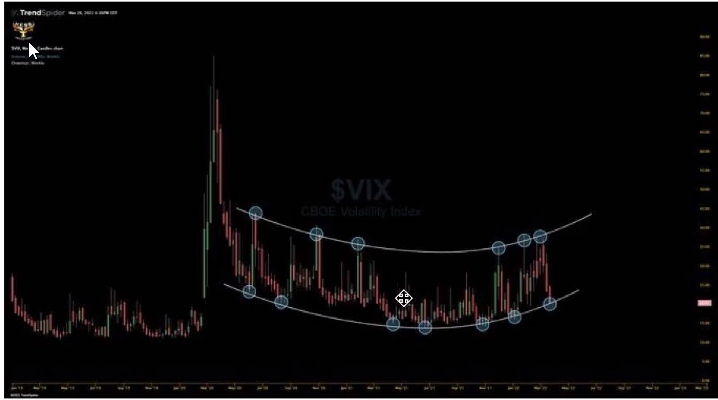
Daily chart of VIX over the last few years
Here’s the VIX over the past year and more. The bottom of the trough is the least fear. This chart suggests that the VIX could be due for a spike! I’m seeing higher lows and higher highs. The overall structure of the VIX continues to move higher!
Good traders love volatility! My job is simply to be aware of what’s going on.
I don’t want to be lulled into thinking we’re in a safe environment when we’re not! I don’t think it’s safe to just buy stocks and hold them right now. I think volatility will return and that this is a trader’s environment. I want to be looking at short-term trades and don’t want to be holding things for very long at this moment in time!
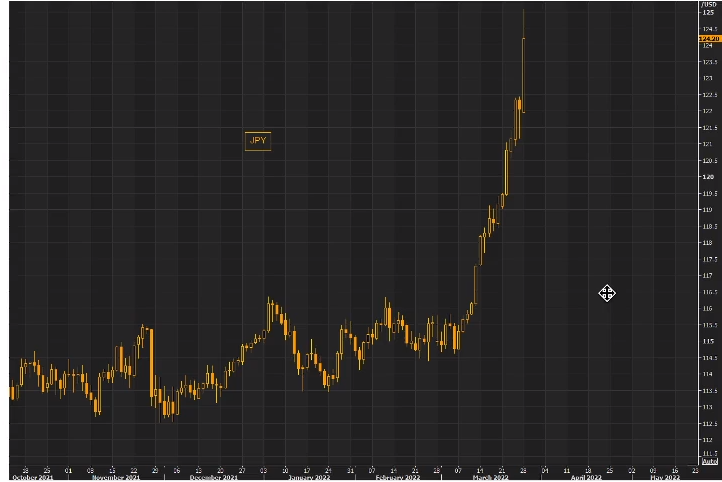
Chart of Japanese Yen
Has anyone been looking at the Yen recently? This chart should be making people nervous. WHY? When you see a foreign currency make moves like this, and this is not Turkey or Russia, this is JAPAN, the 3rd or 4th largest currency in the world. This should get your antenna up! What does this mean for the market? A Yen explosion like this is not good!
If this spike continues, there could be ramifications on worldwide bond markets, which could affect our bonds, which could affect the VIX, and then equities. The spillover effects could be wild!
Great traders should at least be aware of global factors because markets are so interconnected and try to make sense of it.
Given these risks, I don’t want to be an investor for over a month or so. I think right now, I want to be a short-term tactical trader. I want to hold for a couple of days or a week or so maximum and take advantage of the coming volatility that I expect to occur.
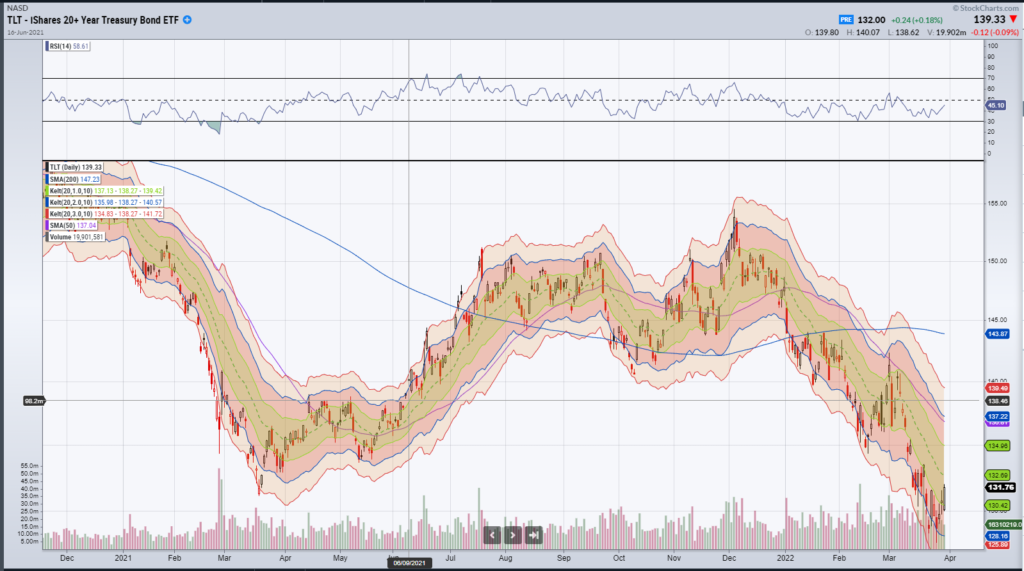
Chart of 20+ year treasury bond ETF- TLT
The bond market continues to sell off. As bond prices fall, that means interest rates are going up.
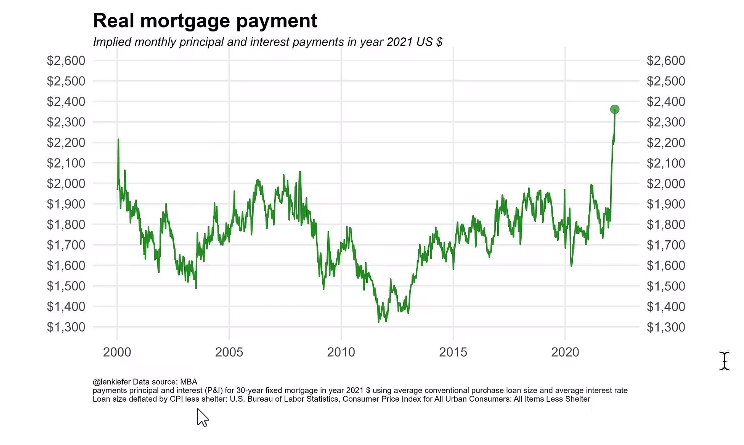
Chart of Real mortgage payments in the U.S
As housing prices and stock markets rose, real mortgage payments stayed low over the last 10 years due to low-interest rates.
However, due to rising inflation and interest rates, real mortgage payments have spiked from below $1,800 to over $2,300 over the past few months. This has longer-term ramifications for the economy as people have less money for discretionary spending and could hit the economy in the longer term!
This could mean property prices begin to fall, which can affect how much people can borrow and invest! How do you play a cooling housing market? I am potentially looking at shorting stocks like Zillow (Z) or the Homebuilders. Maybe I’ll look at attacking lumber stocks or Home Depot (HD), or Lowe’s (LOW)! A good idea could be to short some of the stocks that benefited from the housing boom!
This is just one way to make this trade. But despite the recent market optimism, I think we could be in for some rough sailing ahead!


1 Comments
Thank you for the heads up. Very useful information about a potential market environment