

As much as I feel the market is getting toppy…I’d have to be stubborn to not see the trend.
And while I might be bearish on the SPY near-term, there are several individual stocks I like…
I’m a big believer in “trade what you see” not “trade what you feel”
After all, when it comes to this market…reality is crazier than fiction.
That’s why I wasn’t shy when I hopped into the Masters’ Club this morning to share some of my favorite plays I currently see.
If you missed it…don’t worry…
I’m about to share with you the five symbols I like…and where I think they can go.
Five Stocks On My Radar
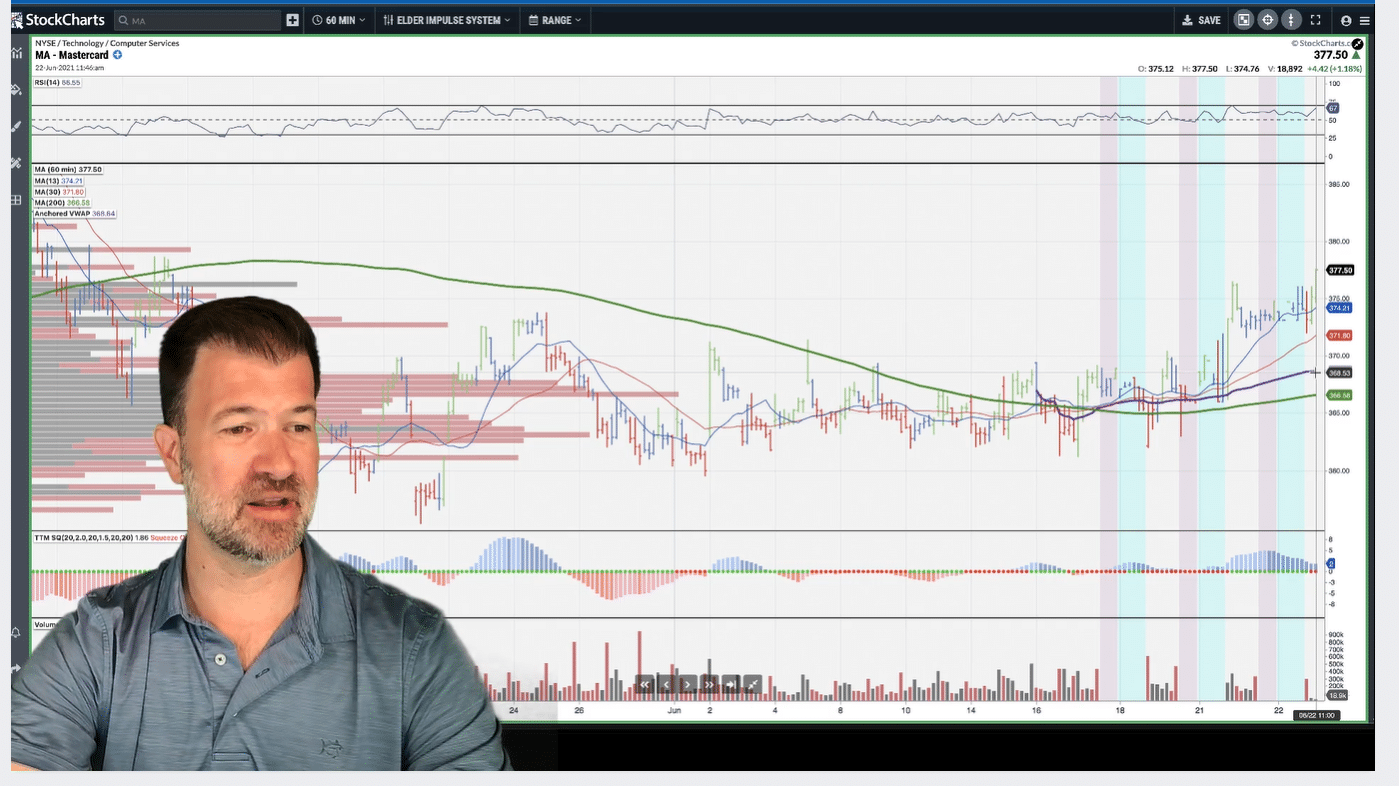
MA

I’ve had this on my radar for a bit now, and now that it’s finally shown strength to get above the 200 hourly support average I think the 13/30 hourly momentum averages can take the stock higher from here.
I want to see a slight pullback into these averages before I start buying at this point.
Technically speaking, MA should pull back off of the recent pivot highs and consolidate prior to moving higher with increased volume off of the 13/30 hourly momentum averages.
Unfortunately, I missed the Symmetrical Triangle that was forming in the stock earlier. I really like to trade these patterns because they set me up for a better risk-to-reward ratio on my trade compared to other technical patterns. Here is a quick trade lesson on how I use this indicator for a lot of my research.
Trade Lesson: Symmetrical Triangles
Symmetrical triangle is a chart pattern characterized by two converging trend lines connecting a series of sequential peaks and troughs. These trend lines should be converging at a roughly equal slope.
Here is an example of how this looks in a stock chart.
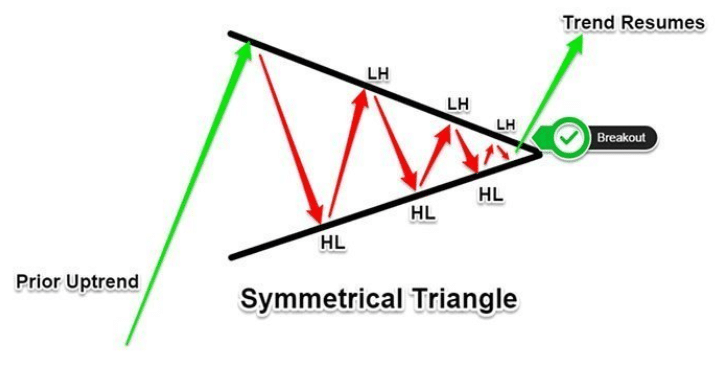
A symmetrical triangle chart pattern represents a period of consolidation before the price is forced to breakout or breakdown. A breakdown from the lower trendline marks the start of a new bearish trend, while a breakout from the upper trendline indicates the start of a new bullish trend. The pattern is also known as a wedge chart pattern.
Since this pattern is being formed in an uptrend, I am looking for this to break out higher as a trend continuation pattern.
One way I will look to potentially play the move up will be by selling OTM put-spreads in July.
SPOT
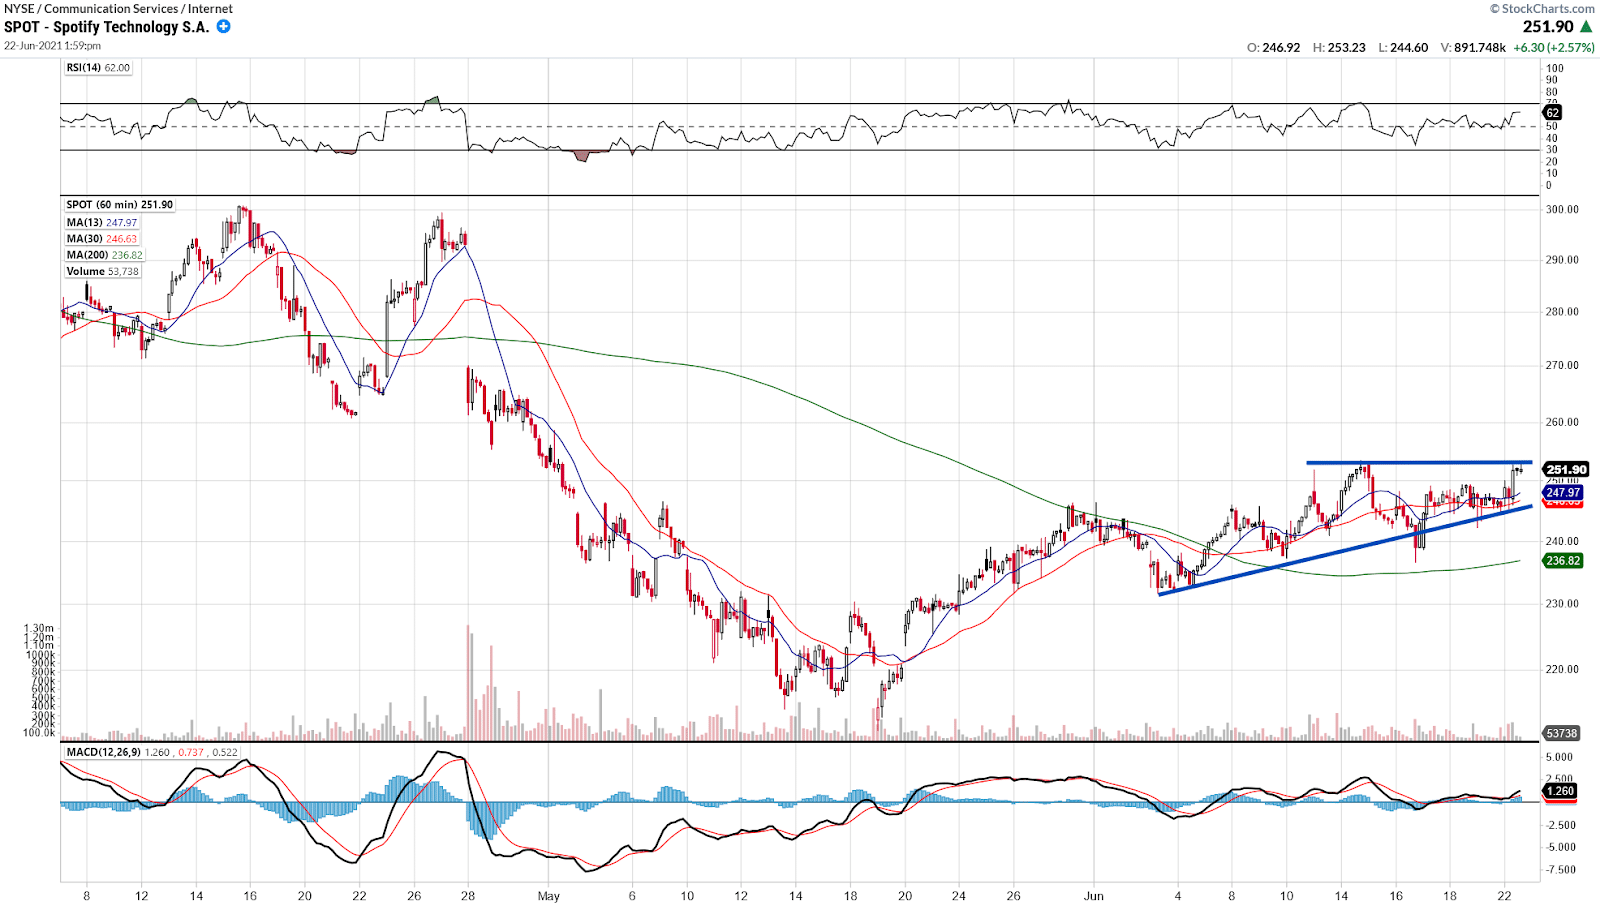
Similar to the last two trades, there is a large consolidation zone that is being formed above the 200 hourly support average. This pattern reminds me of a symmetrical triangle continuation pattern.
If the stock can stay above its 13/30 hourly momentum average it can move higher from here.
If the stock trades higher, I would expect the start of the gap to be the first target. On the chart, the gap I am looking at is the $270 – $290 gap that has yet to be filled keeping buyers trapped in this position.
One thing I hate to do is chase. Instead of buying stock or calls, I often will look to sell OTM put spreads. And that is something I’m looking at here.
TTD
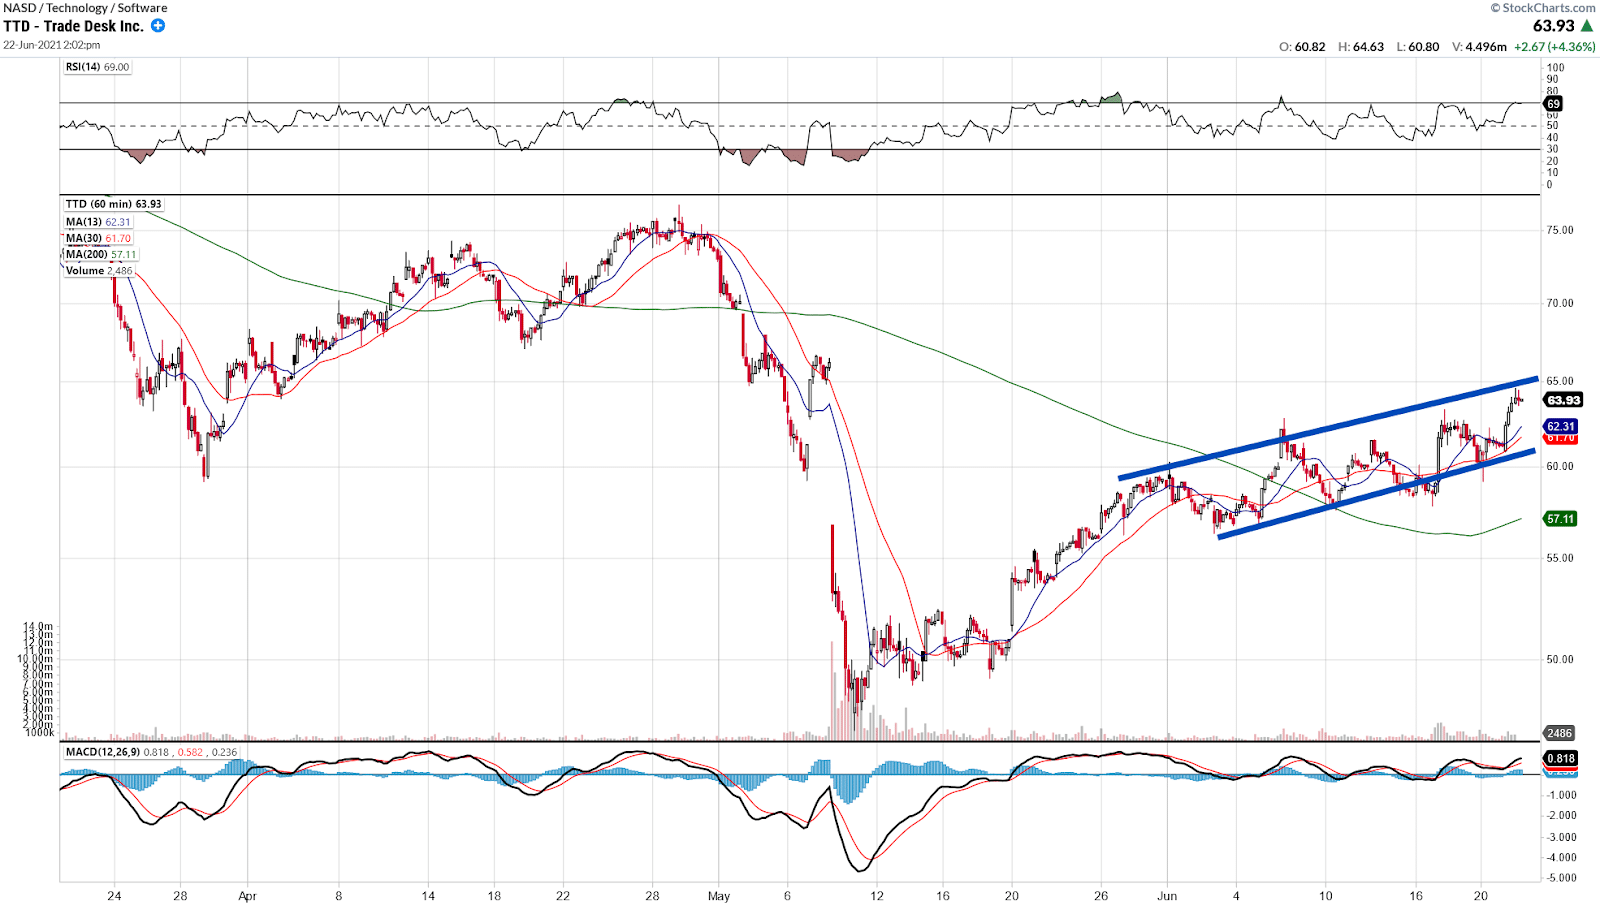
I think this stock is trading in a tight upward channel and slowing grinding higher.
Since there is no breakout level at this time, I will want to wait and see a pullback into the 13/30 hourly momentum averages or the lower trendline of the upward channel, near $61.25 before entering a position.
TRIP
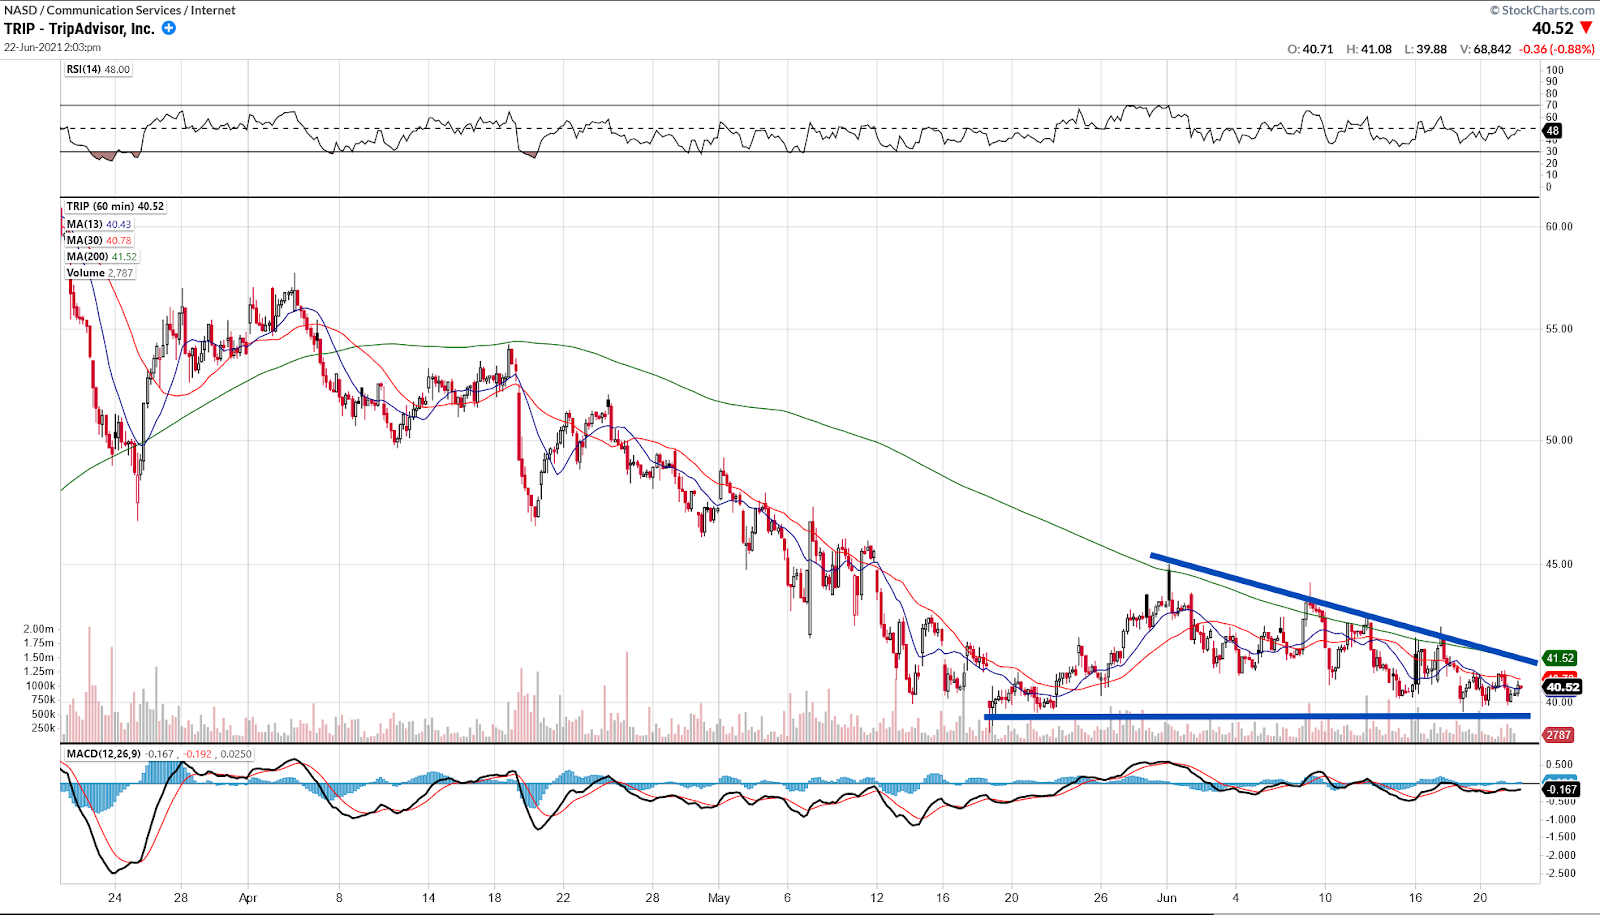
I am noticing there is a large descending triangle that is forming at the bottom of a downtrend.
I think that if the stock can find some buyers around the lower support level and break above the 13/30 hourly momentum averages, we could see the price trade back into the 200 hourly support average.
Since the 200 hourly support average is also near the descending trendline, I think there will be a slight pause in the stock price causing sideways price action from here.
Once the sellers are tired of holding, i think there is going to be higher prices coming up as they cover their shorts and buyers step in at this time.
Trade Lesson: Descending Triangles
Descending Triangles can be tricky, but if traded correctly can give you some of the best risk-to-reward setups on your trade.
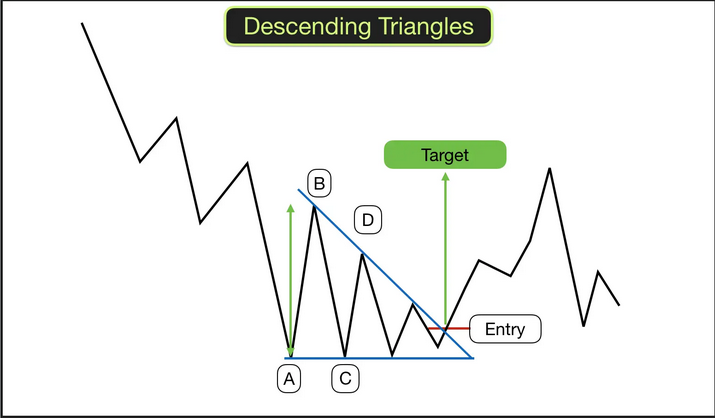
When trading this pattern, you want to ideally buy around points A or C, and if you are a breakout trader, towards the descending resistance line (labeled entry above).
For me, I prefer to buy on the pivot point A and C, but there is nothing wrong with waiting for confirmation of a breakout depending on your trading style.
And the target is calculated by the distance from the entry price to the highest pivot point that formed the triangle, point B.
And a stop is always below the lowest pivot point, in this case, pivot points A or C.
ABNB
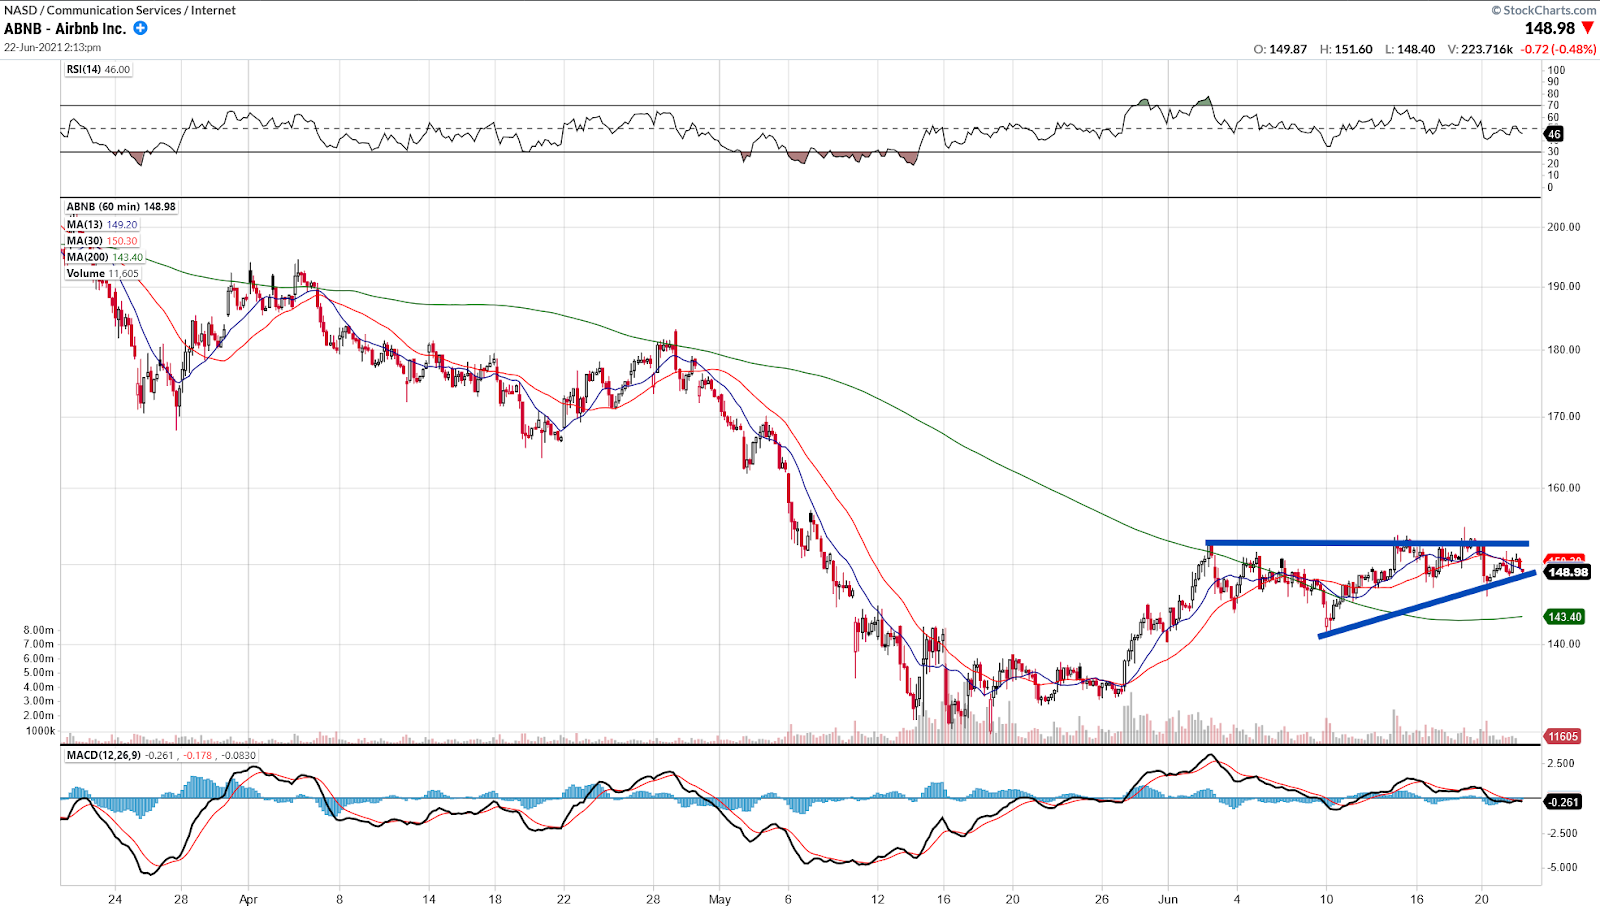
This stock has broken back above its 200 hourly moving average and has been consolidating in a range for the last few days around the $150 level.
I want to see the 13/30 hourly momentum averages hold up and move the stock higher as long as it can break the prior pivot high.
Bottom Line
Don’t let your bias get in the way of what you see on your screen. There have been so many folks over the last year waiting for the market to collapse. While I do believe we’re getting toppy in the SPY, that hasn’t stopped me from getting involved in individual names I like the setup in.


8 Comments
Thanks
I am a newbie (in my late 50s) trading for about one year. This pattern and timing make more sense to me now. I have seen it on previous stocks. Unfortunately, I sold too soon.
THANK YOU JEFF for the teaching points great information, look forward to keeping up with you guys at Ragingbull for years to come!!!
very good lessons
Keep the trades coming
Are the 13/30 and 200 hourly moving averages Simple are Exponential averages?
Hey Kirk! These are simple moving averages!
Hello Jeff,
The ways you are analyzing charts are phenomenal. I like to know and study more about your techniques. I notice that you are using different moving averages with one hour frame time. My question is this frame time is enough to determine the trend way? Please let me know if you YouTube channel. Appreciated