
Total Alpha daily updates focus heavily on intra-day charts that view price action in relation to the 13- and 30-hour moving averages.
Intra-day charts are highly depended on by day traders but underutilized by swing and longer-term position traders that hold positions beyond one day.
No matter your chosen form of trading, you should have at least one intra-day chart included as part of your trading screen setup, in order to better assist you in your efforts to find the best entry and exit points possible.
Today, I am going to show you the very noticeable intra-day volatility pattern that occurs across the major cash indices (i.e., those markets that trade from 9:30 am to 4:00 pm EST and settle in cash), and I’ll explain how this pattern can either work for or against you in your trading.
What causes the US equity market’s intra-day volatility pattern?
Market participants, both carbon-based (i.e., humans) and silicon-based (i.e., computers), are the cause of periodic movement during the day, and an increase in both has caused liquidity to grow across nearly all markets.
Interestingly, though, this has not altered the intraday volatility patterns.
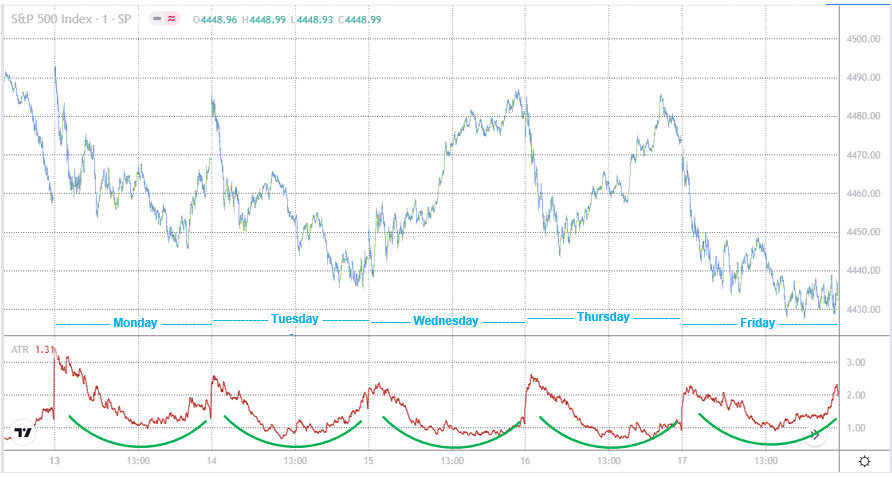
The classic pattern in the benchmark S&P 500 cash index (SPX), which trades from 9:30 am to 4:00 pm EST, M – F, shows the greatest volume near the open, the next highest volume near the close, and the lowest volume at mid-day.
This pattern manifests as a U-shape in popular volatility studies like the Average True Range (ATR) indicator, which is shown in the bottom panel of the 1-minute chart of the S&P 500 cash index directly below.
Figure 1
There are a number of reasons for this normal pattern of trading.
The opening bell
Consider that many investors evaluate their positions and study market reports in the evenings and then place their orders in the morning.
Or, that in Europe, where business begins six hours earlier, economic reports are released before the start of US trading and can affect the early market direction.
These are just a couple of examples of the things that can influence the increased volatility at the start of each trading day.
It’s important to understand that the cash market, which trades from 9:30 am to 4:00 pm EST, will either gap up or down to catch up to whatever movement occurred during the overnight futures market action.
After a short delay, as the first burst of activity slows, many computer algorithms are programmed to sell a strong open and buy a weak one.
Once the opening orders have been executed, volatility then declines as the order flow that has accumulated from decisions made since the last close have dried up.
Scalpers, who are traders aiming to make a rapid trade with the goal of profiting off of a stock’s small movements, are active during the opening minutes but frequently ease up on trading in the afternoon because of the drop-off in volatility.
This can often lead to a temporary price reversal of the trend that had developed during the morning session.
The closing bell
The close of the day is a common time for trading because many investors believe that the closing price best represents the correct value.
It is also the time that many institutions are putting money to work, to take advantage of the increased volume that occurs near session’s end.
Large funds and managed accounts have a specific method for entering the market, such as using close-only orders.
For these large players, trading when volume is heavy allows them to take advantage of VWAP orders (volume-weighted average price) where partial orders are automatically fed into the market based on an algorithm that balances time intervals and volume.
Conclusion
Over time, you’ll get a better feel for how the market tends to react at certain times of the day.
Until you get a hang of things, it’s probably a good idea to avoid entering orders for at least the first 60 minutes of the day, as the extreme volatility during that window can be hard to navigate.
Once the market has been open for an hour and starts to move away from the opening price, the odds increase that the early high or low will be the daily high or low.
Then, if that level is broken, the close becomes the next likely time for a high or low.
On the somewhat rarer occasions when a new high or low is made during the mid-day session, this could be the basis for an intraday breakout strategy for day traders.
Sure, there are certain options strategies, such as selling 0-DTE (zero days to expiration) bull put spreads or bear call spreads that can benefit from being entered during peak opening bell volatility, but these are strategies that take a long time to master and definitely deserve a detailed discussion outside of this one.


