

With markets at all-time highs, it might be hard to comprehend that 2021 has actually been a turbulent year.
Specifically, there’s an entire universe of stocks that exists beyond the major indices, and the very large majority of these stocks have seen significant corrections at one point or another in 2021.
Today, I am going to show you some institutional-level research that proves this. In addition, I am going to show you which sectors are currently delivering alpha over the market as the S&P 500 sits at all-time highs, and I’ll reveal a new trade idea derived from sector rotation.
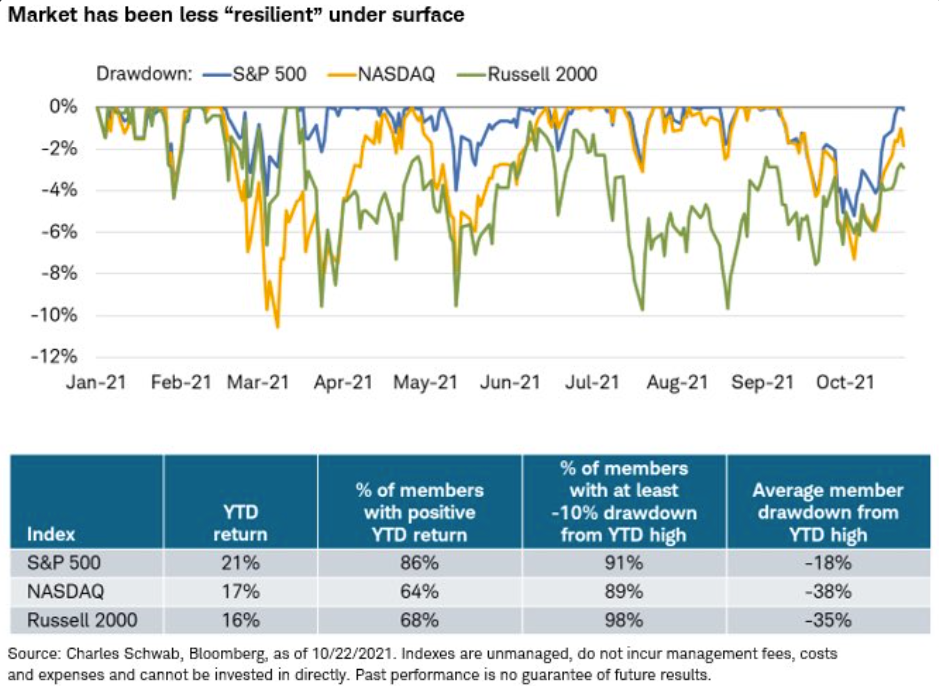
A large percentage of US stocks have undergone meaningful corrections in 2021
As this first chart from Charles Schwab shows, 91%, 89%, and 98% of S&P 500, Nasdaq, and Russell 2000 constituents, respectively, have undergone corrections of at least 10% this year.
Not only that, but the average correction suffered by members of these popular indexes has been a whopping 18%, 38%, and 35%, respectively.
Figure 1
How can that be, you ask?
Well, we’ve spoken about this many times this year, but it bears repeating.
The reason the benchmark S&P 500’s largest correction this year has only been a decline of -5.5% is because it is a cap-weighted index, which means that its price action is largely dependent on the price action of its largest constituents, like MSFT, AAPL, and AMZN.
As the chart above reveals, however, there has actually been tremendous churn occurring behind the curtain of the major indexes this year.
What you may not realize though, is that these stealthy corrections actually make for a healthy market, since, as Charles Schwab’s research shows, the majority of stocks have already witnessed meaningful periods of digestion.
In markets like this, having the necessary tools to generate alpha is of the utmost importance.
But what is alpha and why is it so important?
Alpha is a measure of the performance of an active investment compared with a suitable market index.
Here’s an example:
If an investment has an alpha of 1%, it means that the investment’s return over a selected period of time is 1% better than the market during that same period.
Conversely, a negative alpha means the investment is underperforming the market.
Professional stock market analysts often use sophisticated methods to predict which stocks are poised to generate alpha.
In reality, the process of finding leading and lagging areas of the market doesn’t need to be overly complex.
You too can perform basic quantitative analysis
The most basic form of quantitative analysis is right at a retail trader’s fingertips in the form of relative strength ratio analysis, which can be performed on most charting and trading platforms.
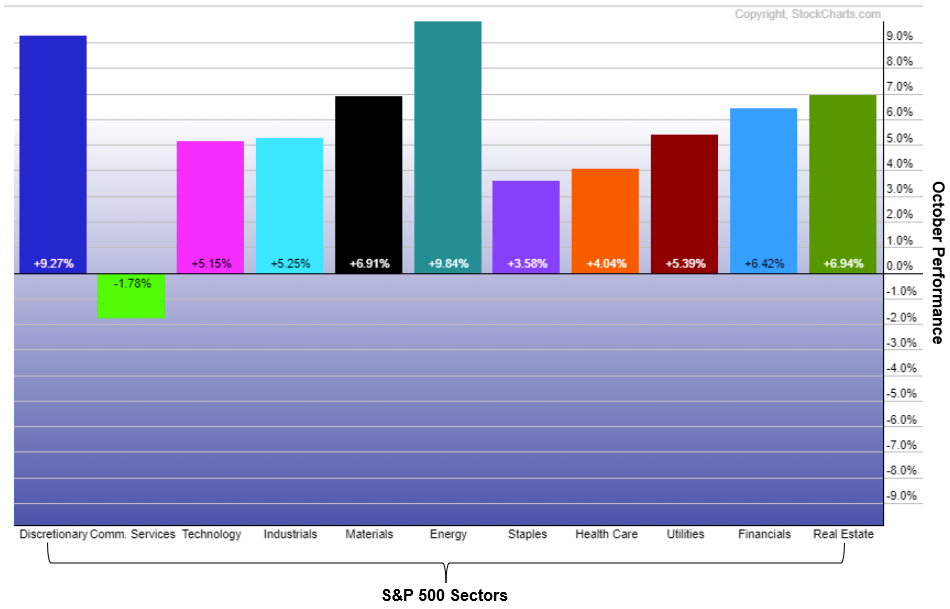
This next set of charts shows all 11 S&P 500 sectors relative to the S&P 500.
Specifically, all I have done on these charts is take each sector and divide it by the S&P 500 to create a ratio.
When the ratio is rising, the sector, which is in the numerator position, is leading (outperforming) the S&P 500.
Conversely, when the ratio is falling, the sector is lagging (underperforming) the S&P 500.
For the month of October, as of Tuesday’s close, the S&P 500 has returned +6.3%.
As Figure 2 shows, the consumer cyclicals, materials, energy, real estate and financials sectors have gained more than the S&P 500 over this same time period.
In other words, these sectors have been generating alpha by leading (i.e., outperforming) the S&P 500 in October.
Figure 2
Now, there is still probably some follow-through strength to be found in these leading sectors over the coming days.
However, it is worth noting that leadership by these sectors is becoming extended.
That does not mean that these sectors are immediately poised to start underperforming.
Instead, it means that leadership from these sectors is growing increasingly vulnerable to slowing.
As traders, one of the most important things you can learn is that sector rotation, where sectors rotate from being leading sectors to becoming lagging sectors, is a never-ending source of opportunities.
With this in mind, I want to focus on one sector in particular.
That sector is the consumer staples sector.
The consumer staples sector is considered to contain companies whose products will always be in demand, no matter what the economy has in store.
Companies like Coca-Cola and Kroger grocery stores are perfect examples.
The problem with this sector is that it tends to underperform the market when the “risk-on” appetite is strong.
If you learn to identify those periods when this sector may be poised to lead, however, it becomes an excellent source of bullish opportunities.
While I am not predicting that the market is poised to undergo a swift correction, I do think that conditions are becoming overbought enough where this sector may soon start to show some leadership.
Here’s what I mean.
Figure 3 shows the S&P 500 as a blue line, and the consumer staples sector divided by the S&P 500 ratio as a gray line. The momentum indicator at the top is the 14-day RSI for the S&P 500, and it is nearing an overbought condition again.
What I’ve highlighted are the periods when the consumer staples sector starts to show leadership as S&P 500 rallies grow tired.
The reason is that professional investors are rotating some of their profits out of riskier sectors and putting some of that money into safer consumer staples stocks.
Figure 3
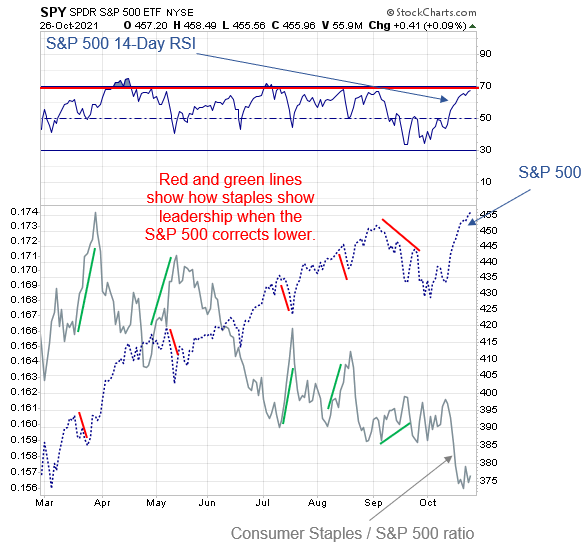
Again, this may be a bit premature, but there is certainly evidence that recent underperformance by the staples sector vs. the S&P 500 is slowing.
With this information, I ran a scan to look for stocks within this sector that might be showing some of my favorite patterns.
Lo and behold, I came across Darling Ingredients Inc. (DAR) which is not only breaking above one of my favorite patterns, an “ascending triangle,” but is also breaking above a larger “inverse head-and-shoulders” continuation pattern.
Headquartered in Irving, Texas, Darling Ingredients Inc. is a provider of rendering, cooking oil, and bakery waste recycling and recovery solutions. It collects and transforms all aspects of animal by-product streams into broadly used and specialty ingredients, such as gelatin, edible fats, feed-grade fats, animal proteins and meals, plasma, pet food ingredients, organic fertilizers, yellow grease, fuel feedstock, green energy, natural casings, and hides. The company also provides grease trap services to food service establishments, environmental services to food processors and sells restaurant cooking oil delivery and collection equipment.
As Figure 4 shows, this setup produced two possible targets.
The first is a post-triangle target at $87.50, followed by the larger post-head-and-shoulders target at $95.50.
Figure 4
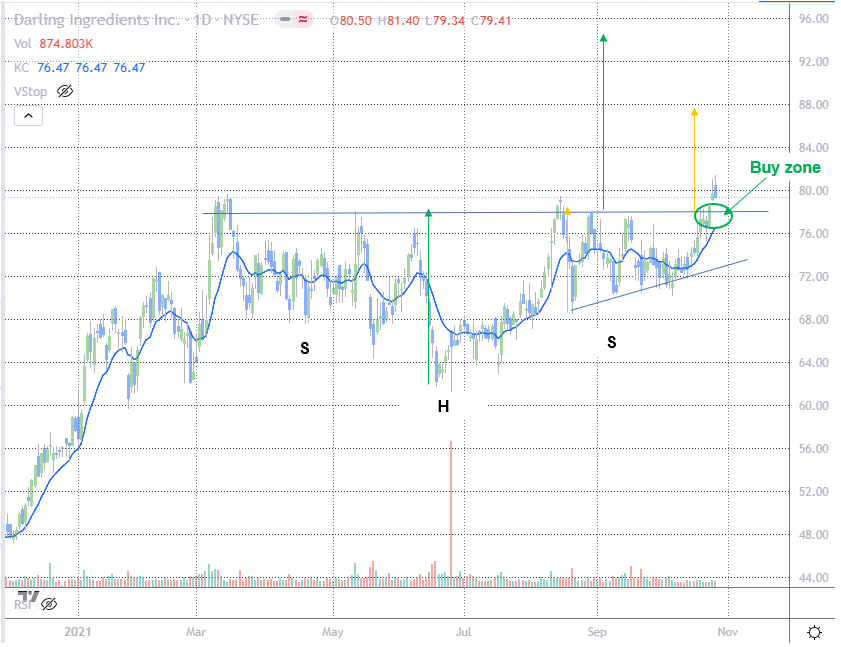
Being that I prefer not to chase trades and I generally want to enter long positions with favorable risk-reward, I would be interested in buying this stock in the event it falls to fill the gap at $78.52 or finds support at the 13-day moving average (currently $76.47).


2 Comments
I liked the article Jeff wrote on DAR. I plan to invest in Dar and watch it. Thank you Jeff
Thanks, Jeff! It’s the 29th, and AMZN was the expiration trade for the strategy today. I missed it!