

When I find stocks with strong price support, I love to use a specific options strategy to take advantage of time decay.
In other words, an options trade that profits from the passage of time as the share price stays above this strong support area over a period of several day.
Today, I am going to show you what I am seeing on the long-term charts of Zoom Video Communications Inc. (ZM) that has me so excited about the bullish trade I am currently waiting patiently to enter in this stock.
After a long period of lower trending prices, ZM looks ready to run again
Zoom Video Communications, Inc. (ZM) was one of the biggest beneficiaries of the Covid 19 crisis, with demand for its online conferencing technology attracting enough interest to drive the company’s share price roughly 700% higher in 2020 alone.
Since the 2020 highs, though, the stock has been in a downtrend that may have bottomed earlier this month.
Here’s what I am seeing that leads me to believe this.
Figure 1 shows a weekly chart of ZM since its IPO in 2019.
Figure 1
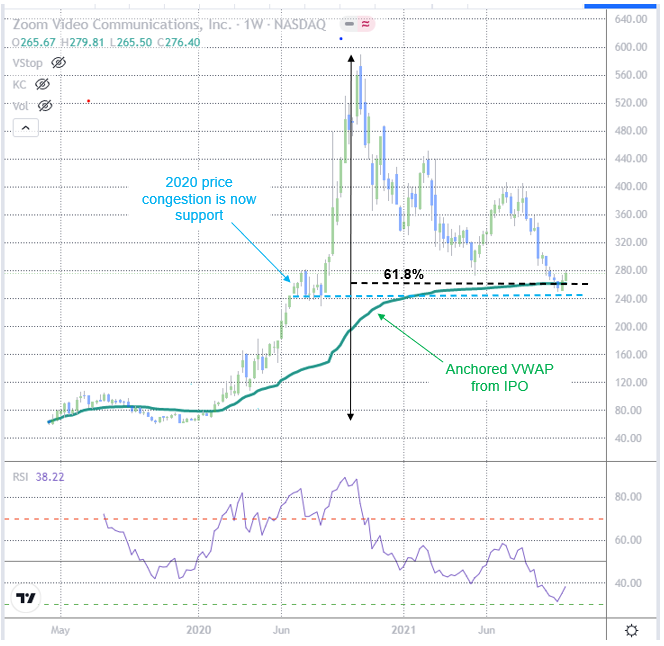
The support I am seeing is significant, as it is made up of the following combination of very important technical tools:
- The Volume Weighted Average Price (VWAP) that has been Anchored at the stock’s IPO price (visit: https://school.stockcharts.com/doku.php?id=technical_indicators:anchored_vwap to learn more about the Anchored VWAP).
- The 61.8% Fibonacci retracement of the entire move from the stock’s all-time low to its all-time high.
- The June 2020 through August 2020 price range.
To repeat, this is a powerful combination of support levels that, along with the extremely oversold weekly price action that developed earlier this month, gives the stock some of the best odds in months that it has found support that can hold for a long period of time..
I don’t like to chase rallies, so I’m being patient
Short-term, Figure 2 shows the stock has been rallying above the 200 hourly moving average, which is a key level above which new buyers are starting to enter.
Figure 2
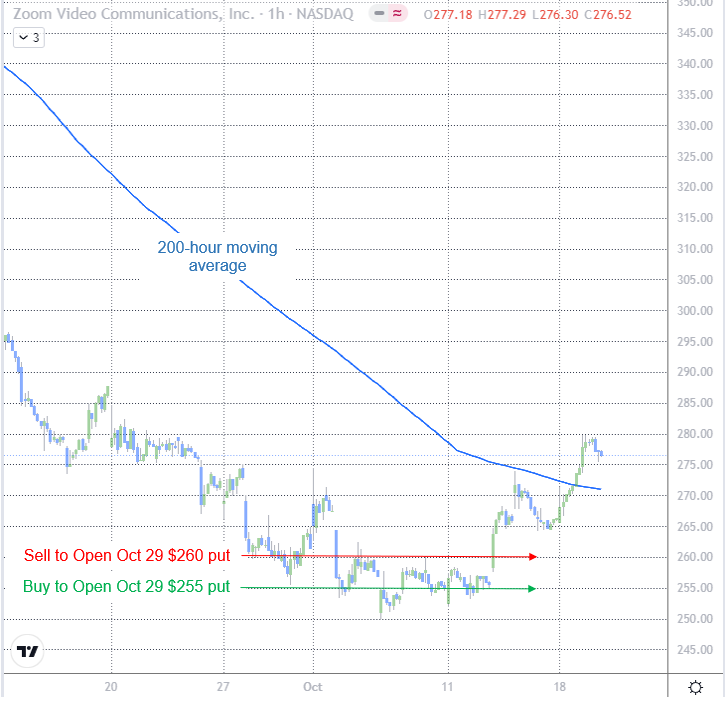
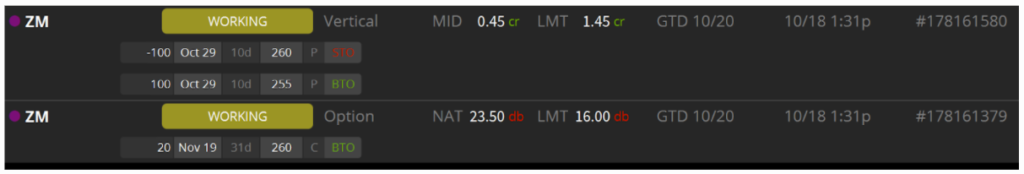
Figure 3
However, I don’t want to chase prices here so I’ll wait for a pullback before entering this trade.
In order to prevent chasing this stock higher, I’m using limit orders to control my trading emotions.
And to prevent waiting too long, this purchase order will expire at the end of day today (10/20/2021).
Here’s a trading lesson on how I am playing this trade.
Trading Lesson: Time Decay
As Figure 2 also shows, I am trying to sell a vertical put spread, the details of which are shown in Figure 3, that will benefit from the passage of time, otherwise known as time decay, as the stock remains above the $260 area.
Time Decay is a great tool for option traders, especially option sellers!
Time decay is a measure of the rate of decline in the value of an options contract due to the passage of time. Time decay accelerates as an option’s time to expiration draws closer since there’s less time to realize a profit from the trade.
3 Key Aspects To Time Decay:
Time decay is the rate of change in value to an option’s price as it nears expiration.
Depending on whether an option is in-the-money (ITM), time decay accelerates in the last month before expiration.
The more time left until expiry, the slower the time decay while the closer to expiry, the more time decay increases.
How Time Decay Works:
Time decay is the reduction in the value of an option as the time to the expiration date approaches. An option’s time value is how much time plays into the value—or the premium—for the option. The time value declines or time decay accelerates as the expiration date gets closer because there’s less time for an investor to earn a profit from the option.
Figure 4 shows a chart of Time Decay :
Figure 4
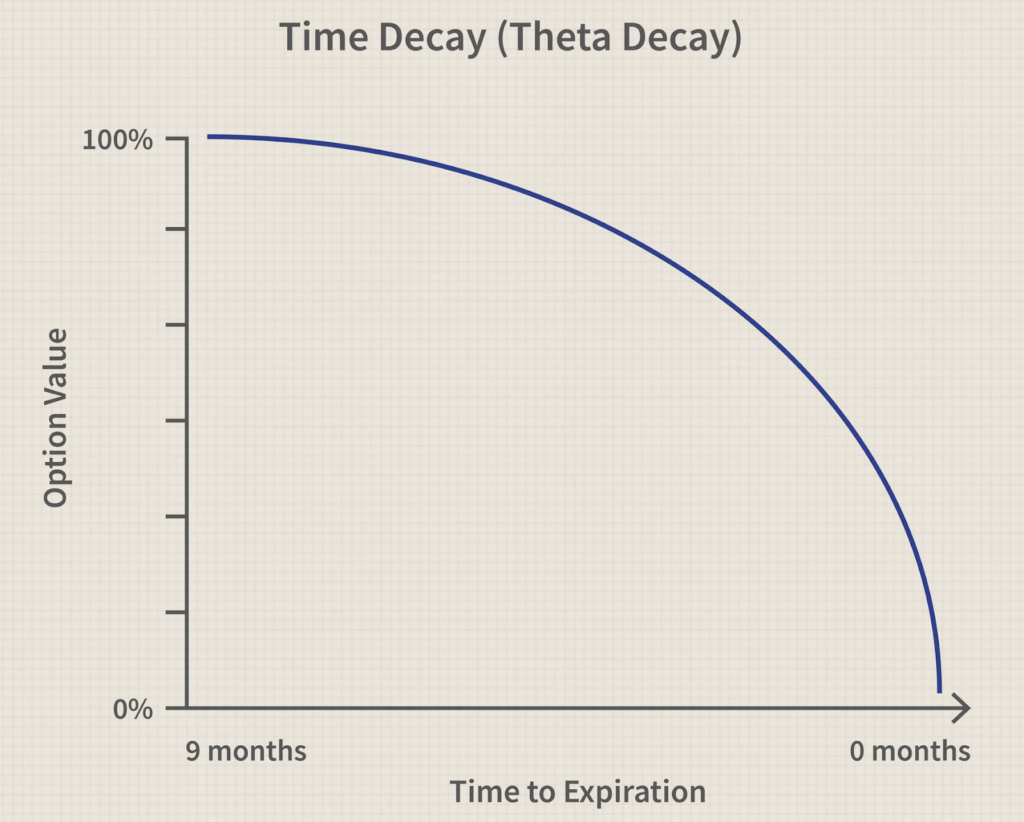
You see, the closer you get to expiration the faster the option value races towards 0% value!
Vertical spreads are easy to apply and offer favorable success probabilities
When it comes to learning multi-leg options strategies, vertical credit spreads are among the easiest and are therefore a great place to start.
Why are they relatively easy to comprehend?
Because they include either selling one put and buying one put (bull put spread) or selling one call and buying one call (bear call spread), and only include options of the same expiration month.
The maximum gain that can be earned from a credit spread is the net credit, realized when both options expire out of the money.
The maximum loss potential is the difference in strike prices – net credit. Realized when both options expire in the money.
Conclusion
The best support areas are those that are made up of multiple technical levels. Since ZM is rebounding from a combination of strong technical levels, I want to take advantage of the fact that price is likely to remain above these technical levels for a while by using an options strategy (the bull put vertical credit spread) that will benefit from the passage of time.


1 Comments
Thanks, Jeff! KD