As traders, it’s easy to get comfortable trading in certain time parameters.
Day traders, by definition, are in a position after the opening bell and selling that position before the market closes, while a swing trader tends to have more of an open mind about how long he or she might be in a trade.
Though, it’s probably safe to say that it’s not common for a swing trader to enter a position with the thought that he or she will be holding that position for months to come.
Instead, their initial plan is usually to hold for a couple of days to a few weeks.
Using a rather traditional swing trader mindset, I recently bought calls in a stock that expire on October 8th.
While the stock has struggled to rise in my favor, the longer-term technical setup is interesting enough to make me consider buying the shares outright for a multi-month swing trade. Today, I am going to walk you through that setup.
Jumia Technologies (JMIA) is at a long-term buy zone
This past week, I went long 50 of the JMIA $18 calls that expire on Oct 08.
My initial thoughts when entering the trade were that gauging upside is really tough on a stock like this, but I would plan to scale out for a profit if JMIA happened to hit $22, and then $24 on the remainder.
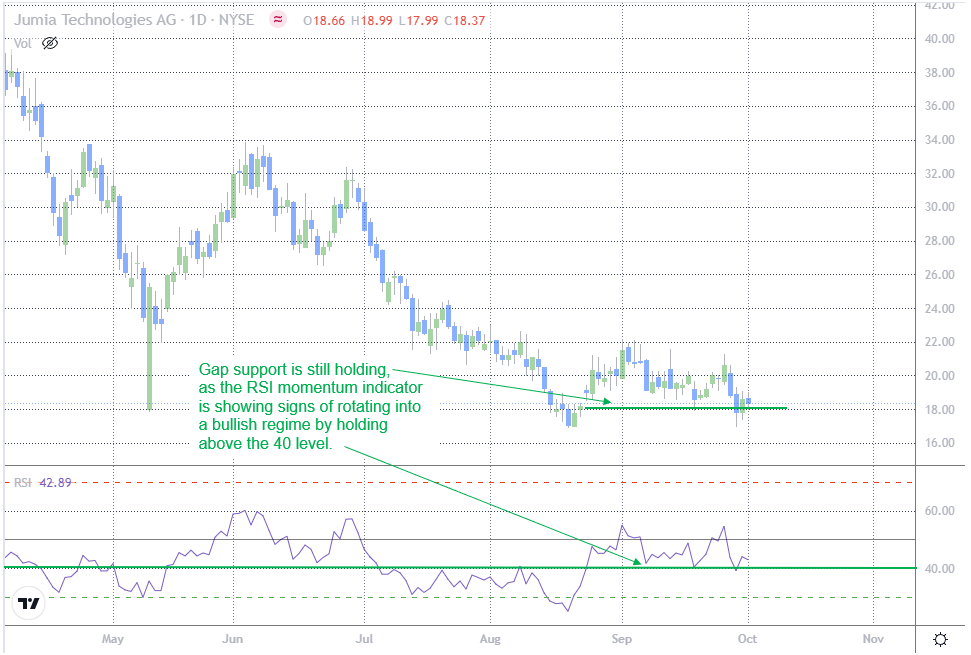
The other thing I liked about the trade at the time of entry was the limited downside that existed to the nearest key support level in the area of the 08/23 to 08/24 gap shown on Figure 1 below.
Figure 1

Remember, there’s an old adage on Wall Street that says, “all gaps get filled, eventually.”
Once these gaps are filled, they tend to hold, at least initially, which means traders must learn to use these gaps as key levels to set as stopout protection.
At the time I brought this shorter-term swing trade to the attention of my readers, I also noted that “for $20 I would also like to flat out buy the stock and hold it for a while.”
Let’s take a closer look at some of the key technical developments that also have me wanting to acquire shares for a long-term investment.
Headquartered in Berlin, Germany, Jumia Technologies AG provides e-commerce services, offering products that include dresses, leggings, skirts, polo shirts, belts, watches, sunglasses, health products, beauty products and a range of products for children, among others.
Based on analysts offering 12-month price targets for JMIA in the last 3 months, the average price target is $23 with a high estimate of $25 and a low estimate of $21.
Interestingly, though, all analysts that currently cover the stock sit with a hold rating.
There’s another old Wall Street adage that says, “nothing changes sentiment quite like price.”
In this case, that means there’s plenty of potential fuel for a longer-term bullish trade if the technicals start to turn bullish and force analysts to start a Buy recommendation bandwagon.
But what about the technicals?
What, if anything, are the technicals showing that is potentially positive for a longer-term notation in price to the upside?
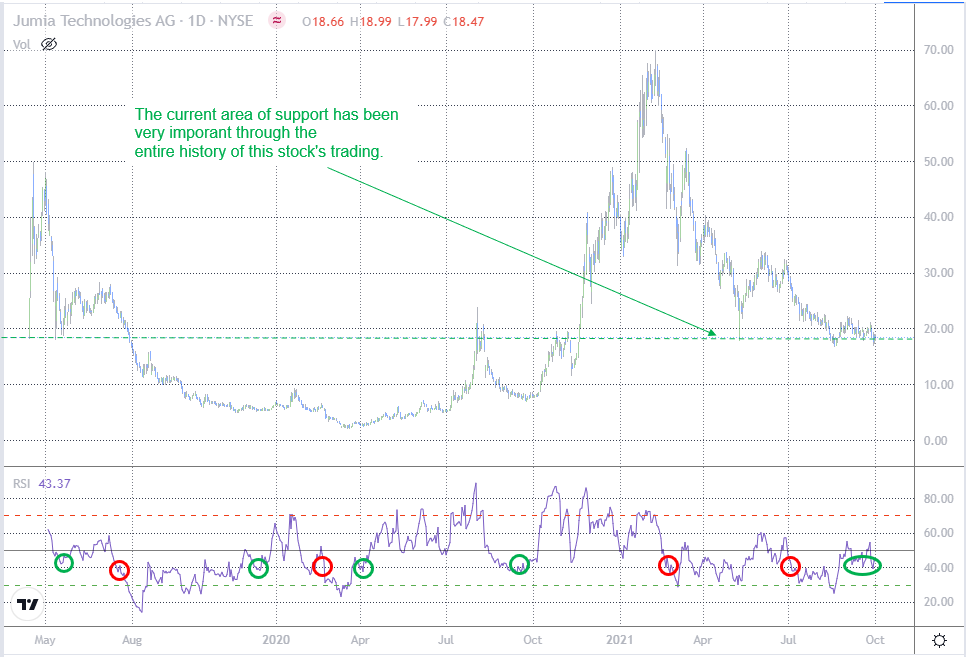
Quite simply, as is revealed in both Figures 1 and 2, I like what the RSI (Relative Strength Index) momentum indicator has been doing.
Much more than a simple indicator of overbought and oversold conditions, the RSI momentum indicator is a trend strength indicator.
Unfortunately, RSI is one of the most misused indicators in all of technical analysis, but that’s a discussion that demands its own lengthy commentary.
For today, I’d like to discuss its use as an early indication of meaningful trend rotation.
Here’s how to use RSI to spot the start of a new bull trend
On Figure 2, you’ll notice that, since rotating its way up from an oversold reading of 25, the default 14-day RSI indicator recently bounced off of the 40 level.
Why is this important?
Because 40 is considered the bottom of a bullish momentum regime for this indicator. Conversely, 60 is the top of a bearish momentum regime.
In other words, if a stock is in the midst of a downside correction, and the RSI indicator holds above 40 during that correction, it is an indication that the correction is healthy, and that the trend mechanics are bullish.
On the opposite side of the spectrum, if a stock were in the midst of an upside correction (i.e. bouncing after a long-term downtrend), and the RSI indicator held below 60 during that correction, it is an indication that the correction is healthy, and that the trend mechanics are bearish.
Figure 2

As the green circles on Figure 2 show, there are a number of examples during JMIA’s relatively short trading history when the stock was in the midst of trying to bottom and the RSI held the 40 level, leading to meaningful rallies in the months that followed.
I’ve also used red circles to highlight the numerous times the stock price has broken down into more prolonged downtrends when the RSI indicator failed to hold the 40 level.
Conclusion
While price should always be the ultimate arbiter in any trader’s trading plan, RSI, when used properly, can be a powerful tool for helping us understand when it is time to speculate that the odds of a future price rally have improved.
Given what I am seeing on the chart of JMIA right now, I want to be a longer-term holder of JMIA shares until either price or RSI tell me that the recent bottoming effort has broken down.
That will either occur with a close below the most recent pivot low at $17.98 or if RSI rotated below 40 on a closing basis.


