

Whether it be fighting the urge to commit 100% of our capital to a trade setup we feel is destined to be a home run (NEVER do this, by the way) or trying to pick the exact point at which a stock is going to bottom, accepting that each day is a battle between one’s self and the market is essential to becoming a successful trader.
When it comes to picking price bottoms, traders must recognize that it is nearly impossible to pick the exact price low.
And every time you fail at picking the exact bottom, you must examine what went wrong so you can improve your odds the next time around.
Chasing stocks at Total Alpha is rare
I rarely chase trades and usually wait for stocks to come to me.
This past week, I waited patiently to buy the low-end of the range in shares of DoorDash (DASH) using a bullish vertical put spread.
As often happens, though, the stock bottomed just before I could get the trade on.
Today, I am going to show you the technical setup that made me so excited about entering a long position in this stock, because it is the kind of setup that produces favorable odds at producing a strong price bottom.
As part of my daily Total Alpha updates, I am constantly preaching how I don’t like to chase trades.
I do the hard work of trying to identify multiple trading ideas each day, and I recognize that many of these ideas may not reach the levels that I believe are the right levels to buy or sell at.
This was the case with shares of DASH this week, and I must say I am not surprised the stock bottomed, given the strong technical setup which we’ll discuss in a moment.
The app-based food-delivery industry is under attack
In the latest of many efforts to regulate the burgeoning app-based food-delivery industry, it was announced that California will soon give tip protections to delivery workers and require more transparency from DoorDash Inc. and other food-delivery apps under a bill signed into law by Gov. Gavin Newsom this past Tuesday night.
AB 286 requires delivery apps like DoorDash (DASH), Uber Eats (UBER) and Grubhub to give delivery workers all their tips. The bill also prohibits food-delivery apps from charging customers more than restaurants do. And it addresses hidden fees by requiring the companies to disclose to restaurants and customers a detailed cost breakdown of each transaction.
After reading this, you might be wondering why I’d be interested in buying shares of a company that operates in an industry that is in the midst of increasing regulation.
It’s because I believe in the future profitability of this industry, as well as the strength of the higher price trend in DASH shares.
In addition, I recognize that growth industries such as this often face regulation in the early stages.
DASH bottomed at a confluence of support levels this week
Through the process of “price discovery,” DASH shares bottomed on this past Tuesday’s news, in what appears to be a case of “buy the rumor, sell the news.”
Teachable moment:
Investopedia defines “price discovery” as the overall process, whether explicit or inferred, of setting the spot price or the proper price of an asset, security, commodity, or currency. The process of price discovery looks at a number of tangible and intangible factors, including supply and demand, investor risk attitudes, and the overall economic and geopolitical environment. Simply put, it is where a buyer and a seller agree on a price and a transaction occurs.
Strong support for this reversal came from a combination of levels, both technical and fundamental.
On the fundamental side, according to the issued ratings of 24 analysts in the last year, the consensus rating for DoorDash stock is Buy based on the current 11 hold ratings and 13 buy ratings for DASH.
More importantly, though, is that the average twelve-month price target for DoorDash is $198.65, which, as Figure 1 shows, just about lines up with the early September breakout area and the widely followed 50-day moving average.
But that’s not it!
Even momentum was giving supportive signals, with the default RSI indicator coming close to touching the 40 level at the time.
Teachable moment:
RSI is a trend strength indicator as much as it is an overbought/oversold indicator, and when RSI bottoms above the 40 level (the bottom of its bullish range) during a downside price correction it is a sign that the long-term trend strength is healthy.
Figure 1
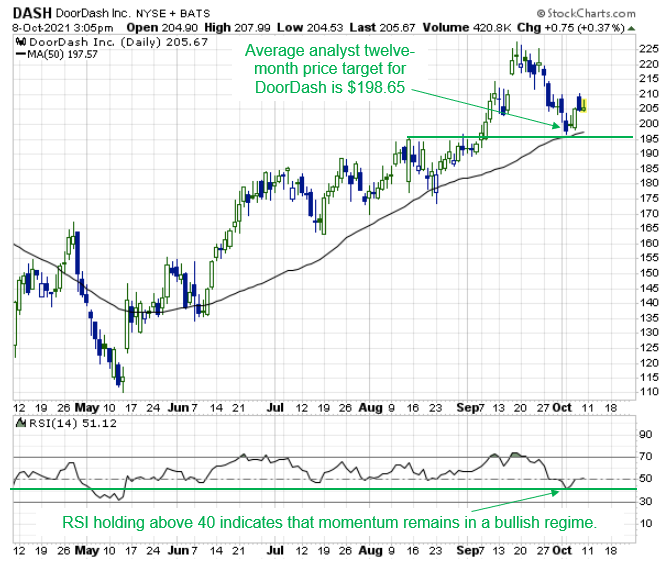
Simply put, this was a powerful picture of support, from both technical and fundamental sources.
As traders, we constantly have to learn from things such as this missed trade.
In this instance, I learned that since there was such strong support, many other traders probably had the same idea I did.
Therefore, when I run into a similar support picture next time, I’ll be sure to align my entry just a little bit above the big support confluence to beat the crowd.


1 Comments
fantastic points altogether, you simply gained a logo new reader.
What may you recommend in regards to your post that you made
a ffew days in the past? Any positive?